[←][→] ath
| functional annotation | ||||||||||||||||||||||||||||||||||
| Function | sucrose transporter 4 |


|
||||||||||||||||||||||||||||||||
| GO BP |
|
|||||||||||||||||||||||||||||||||
| GO CC |
|
|||||||||||||||||||||||||||||||||
| GO MF |
|
|||||||||||||||||||||||||||||||||
| KEGG | ||||||||||||||||||||||||||||||||||
| Protein | NP_172467.1 | |||||||||||||||||||||||||||||||||
| BLAST | NP_172467.1 | |||||||||||||||||||||||||||||||||
| Orthologous | [Ortholog page] SUT4 (sly) LOC9266530 (osa) LOC11430272 (mtr) LOC25490158 (mtr) VVSUC11 (vvi) LOC100240688 (zma) LOC100787939 (gma) LOC100820483 (gma) LOC103843325 (bra) LOC103871775 (bra) | |||||||||||||||||||||||||||||||||
| Subcellular localization wolf |
|
|||||||||||||||||||||||||||||||||
| Subcellular localization TargetP |
|
|||||||||||||||||||||||||||||||||
| Gene coexpression | ||||||||||||||||||||||||||||||||||
| Network*for coexpressed genes |
|
|||||||||||||||||||||||||||||||||
|---|---|---|---|---|---|---|---|---|---|---|---|---|---|---|---|---|---|---|---|---|---|---|---|---|---|---|---|---|---|---|---|---|---|---|
| Coexpressed gene list |
[Coexpressed gene list for SUT4] | |||||||||||||||||||||||||||||||||
| Gene expression | ||||||||||||||||||||||||||||||||||
| All samples | [Expression pattern for all samples] | |||||||||||||||||||||||||||||||||
| AtGenExpress* (Development) |
264662_at
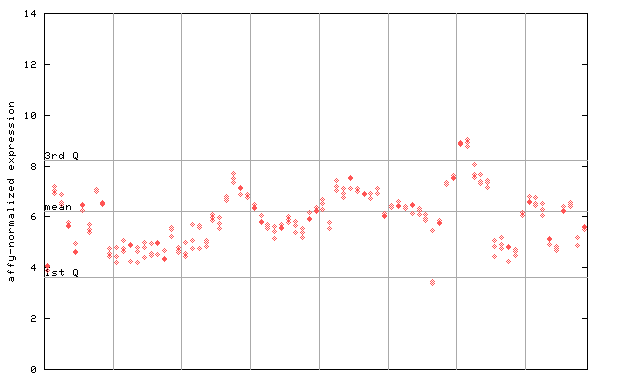
X axis is samples (pdf file), and Y axis is log2-expression. |
|||||||||||||||||||||||||||||||||
| AtGenExpress* (Stress) |
264662_at
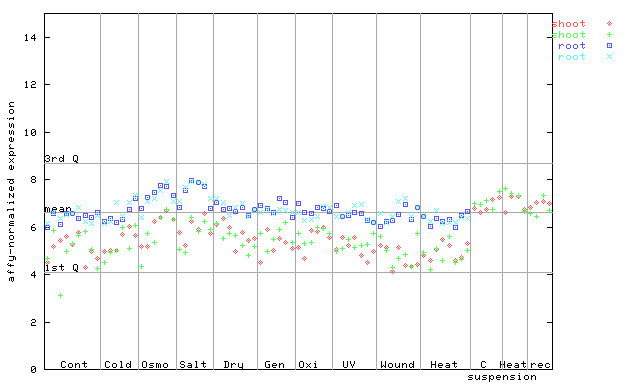
X axis is samples (pdf file), and Y axis is log2-expression. |
|||||||||||||||||||||||||||||||||
| AtGenExpress* (Hormone) |
264662_at
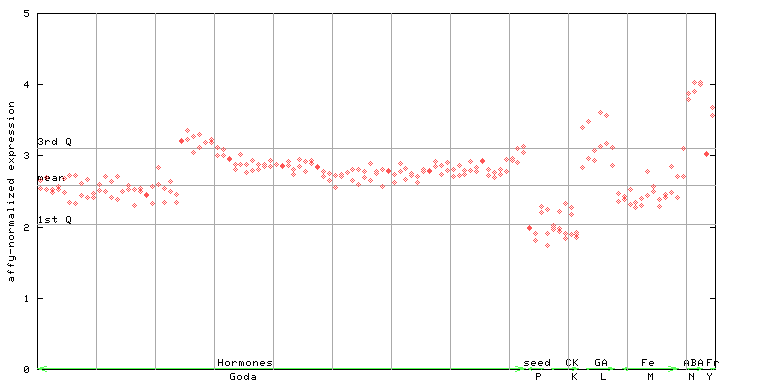
X axis is samples (xls file), and Y axis is log-expression. |
|||||||||||||||||||||||||||||||||


")
| Link to other DBs | ||
| Entrez Gene ID | 837530 |
|
| Refseq ID (protein) | NP_172467.1 | |
The preparation time of this page was 0.2 [sec].