[←][→] ath
| functional annotation | ||||||||||||||
| Function | P-glycoprotein 10 |


|
||||||||||||
| GO BP |
|
|||||||||||||
| GO CC |
|
|||||||||||||
| GO MF |
|
|||||||||||||
| KEGG | ath02010 [list] [network] ABC transporters (26 genes) |  |
||||||||||||
| Protein | NP_001320481.1 NP_172538.1 | |||||||||||||
| BLAST | NP_001320481.1 NP_172538.1 | |||||||||||||
| Orthologous | [Ortholog page] ABCB2 (ath) LOC4330390 (osa) LOC7491869 (ppo) LOC11420554 (mtr) LOC11444259 (mtr) LOC100191944 (zma) LOC100248951 (vvi) LOC100809752 (gma) LOC100810688 (gma) LOC100819045 (gma) ABCB13 (sly) LOC103861599 (bra) LOC103863726 (bra) LOC103871850 (bra) | |||||||||||||
| Subcellular localization wolf |
|
|||||||||||||
| Subcellular localization TargetP |
|
|||||||||||||
| Gene coexpression | ||||||||||||||
| Network*for coexpressed genes |
||||||||||||||
|---|---|---|---|---|---|---|---|---|---|---|---|---|---|---|
| Coexpressed gene list |
[Coexpressed gene list for PGP10] | |||||||||||||
| Gene expression | ||||||||||||||
| All samples | [Expression pattern for all samples] | |||||||||||||
| AtGenExpress* (Development) |
261829_at
X axis is samples (pdf file), and Y axis is log2-expression. |
|||||||||||||
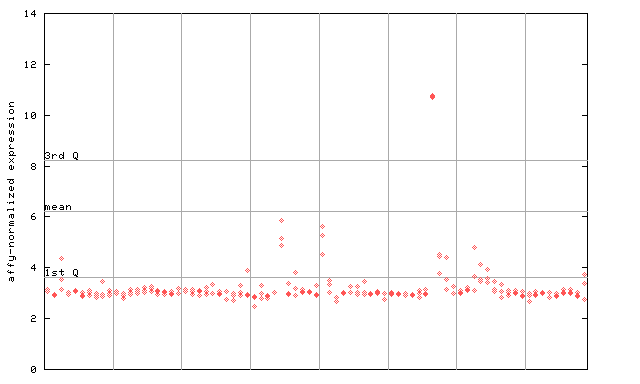
| AtGenExpress* (Stress) |
261829_at
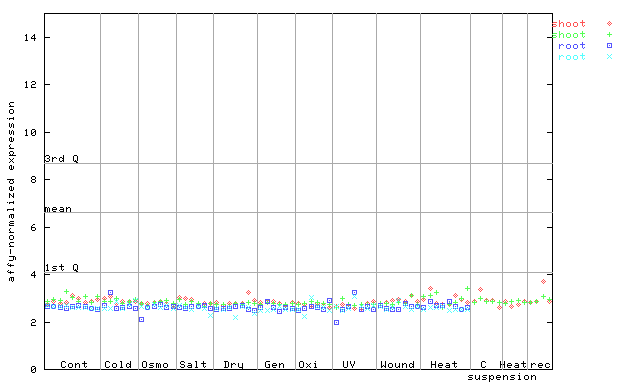
X axis is samples (pdf file), and Y axis is log2-expression. |
|||||||||||||
| AtGenExpress* (Hormone) |
261829_at
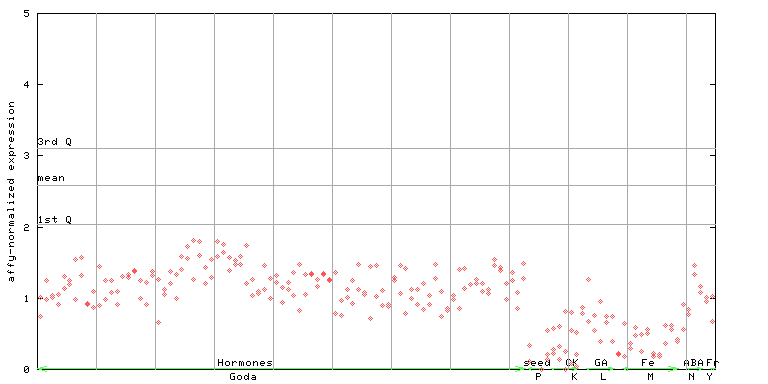
X axis is samples (xls file), and Y axis is log-expression. |
|||||||||||||

| Link to other DBs | ||
| Entrez Gene ID | 837611 |
|
| Refseq ID (protein) | NP_001320481.1 | |
| NP_172538.1 | |
|
The preparation time of this page was 0.2 [sec].