[←][→] ath
| functional annotation | ||||||||||||||||||||||||||||||||||||||||||||
| Function | starch synthase 3 |


|
||||||||||||||||||||||||||||||||||||||||||
| GO BP |
|
|||||||||||||||||||||||||||||||||||||||||||
| GO CC |
|
|||||||||||||||||||||||||||||||||||||||||||
| GO MF |
|
|||||||||||||||||||||||||||||||||||||||||||
| KEGG | ath00500 [list] [network] Starch and sucrose metabolism (172 genes) |  |
||||||||||||||||||||||||||||||||||||||||||
| Protein | NP_001184965.1 NP_172637.2 | |||||||||||||||||||||||||||||||||||||||||||
| BLAST | NP_001184965.1 NP_172637.2 | |||||||||||||||||||||||||||||||||||||||||||
| Orthologous | [Ortholog page] LOC4337056 (osa) LOC7479050 (ppo) LOC25486162 (mtr) LOC100136992 (tae) LOC100316882 (sly) LOC100790973 (gma) LOC100797872 (gma) LOC100801729 (gma) LOC103836215 (bra) LOC103871924 (bra) LOC123180520 (tae) LOC123190488 (tae) LOC123425502 (hvu) LOC123427900 (hvu) | |||||||||||||||||||||||||||||||||||||||||||
| Subcellular localization wolf |
|
|||||||||||||||||||||||||||||||||||||||||||
| Subcellular localization TargetP |
|
|||||||||||||||||||||||||||||||||||||||||||
| Gene coexpression | ||||||||||||||||||||||||||||||||||||||||||||
| Network*for coexpressed genes |
|
|||||||||||||||||||||||||||||||||||||||||||
|---|---|---|---|---|---|---|---|---|---|---|---|---|---|---|---|---|---|---|---|---|---|---|---|---|---|---|---|---|---|---|---|---|---|---|---|---|---|---|---|---|---|---|---|---|
| Coexpressed gene list |
[Coexpressed gene list for SS3] | |||||||||||||||||||||||||||||||||||||||||||
| Gene expression | ||||||||||||||||||||||||||||||||||||||||||||
| All samples | [Expression pattern for all samples] | |||||||||||||||||||||||||||||||||||||||||||
| AtGenExpress* (Development) |
262809_at
X axis is samples (pdf file), and Y axis is log2-expression. |
|||||||||||||||||||||||||||||||||||||||||||
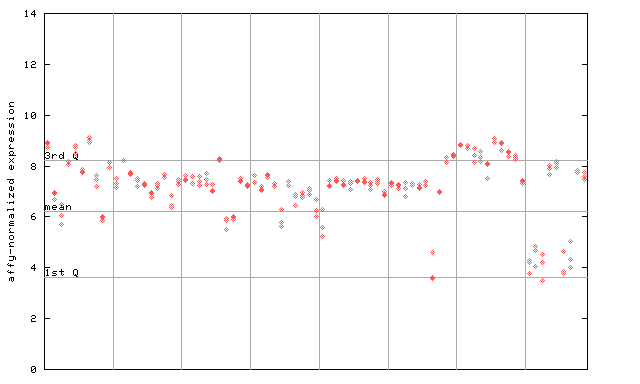
| AtGenExpress* (Stress) |
262809_at
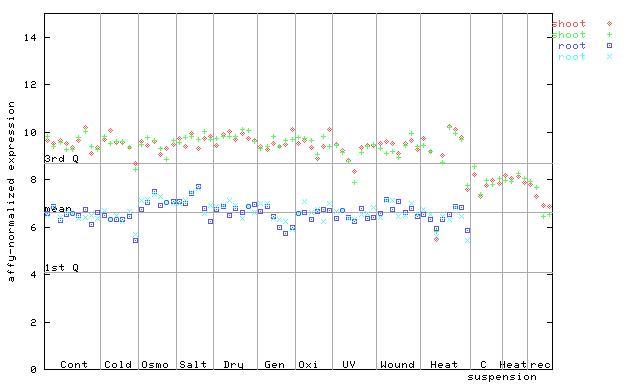
X axis is samples (pdf file), and Y axis is log2-expression. |
|||||||||||||||||||||||||||||||||||||||||||
| AtGenExpress* (Hormone) |
262809_at
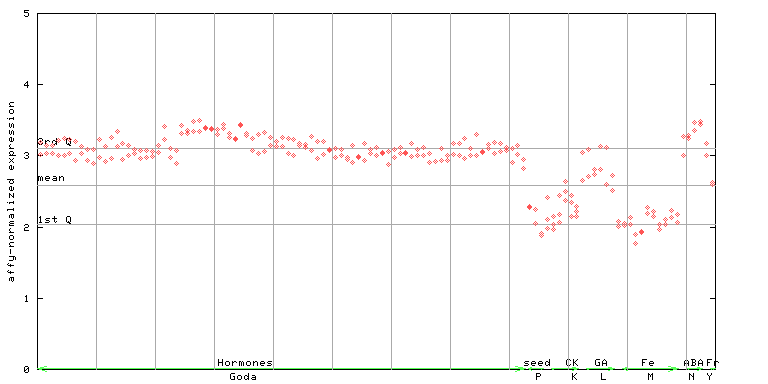
X axis is samples (xls file), and Y axis is log-expression. |
|||||||||||||||||||||||||||||||||||||||||||


")
| Link to other DBs | ||
| Entrez Gene ID | 837716 |
|
| Refseq ID (protein) | NP_001184965.1 | |
| NP_172637.2 | |
|
The preparation time of this page was 0.1 [sec].