[←][→] ath
| functional annotation | ||||||||||||||||||||||||||
| Function | O-Glycosyl hydrolases family 17 protein |


|
||||||||||||||||||||||||
| GO BP |
|
|||||||||||||||||||||||||
| GO CC |
|
|||||||||||||||||||||||||
| GO MF |
|
|||||||||||||||||||||||||
| KEGG | ath00500 [list] [network] Starch and sucrose metabolism (172 genes) |  |
||||||||||||||||||||||||
| Protein | NP_001184967.1 NP_001323381.1 NP_172647.2 | |||||||||||||||||||||||||
| BLAST | NP_001184967.1 NP_001323381.1 NP_172647.2 | |||||||||||||||||||||||||
| Orthologous | [Ortholog page] LOC11439568 (mtr) LOC18097371 (ppo) LOC18111222 (ppo) LOC100776067 (gma) LOC101250269 (sly) LOC103836214 (bra) | |||||||||||||||||||||||||
| Subcellular localization wolf |
|
|||||||||||||||||||||||||
| Subcellular localization TargetP |
|
|||||||||||||||||||||||||
| Gene coexpression | ||||||||||||||||||||||||||
| Network*for coexpressed genes |
|
|||||||||||||||||||||||||
|---|---|---|---|---|---|---|---|---|---|---|---|---|---|---|---|---|---|---|---|---|---|---|---|---|---|---|
| Coexpressed gene list |
[Coexpressed gene list for AT1G11820] | |||||||||||||||||||||||||
| Gene expression | ||||||||||||||||||||||||||
| All samples | [Expression pattern for all samples] | |||||||||||||||||||||||||
| AtGenExpress* (Development) |
264397_at
X axis is samples (pdf file), and Y axis is log2-expression. |
|||||||||||||||||||||||||
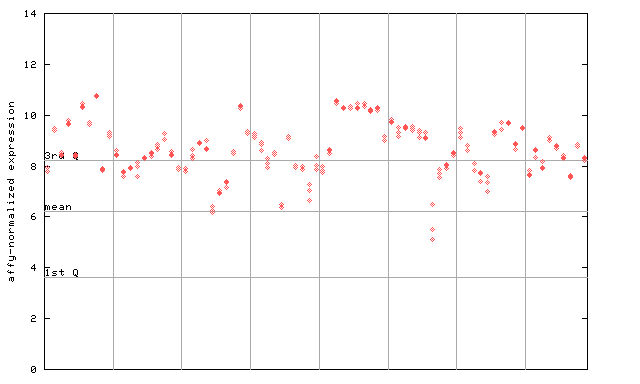
| AtGenExpress* (Stress) |
264397_at
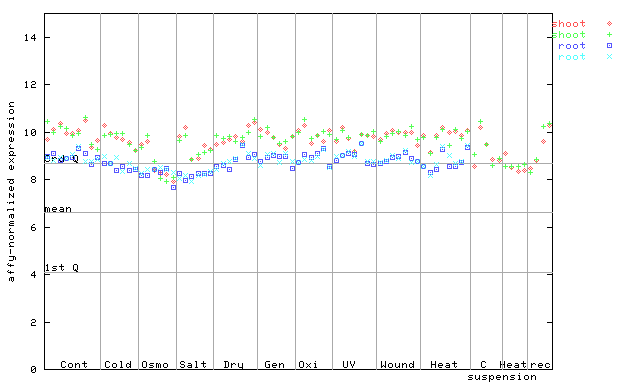
X axis is samples (pdf file), and Y axis is log2-expression. |
|||||||||||||||||||||||||
| AtGenExpress* (Hormone) |
264397_at
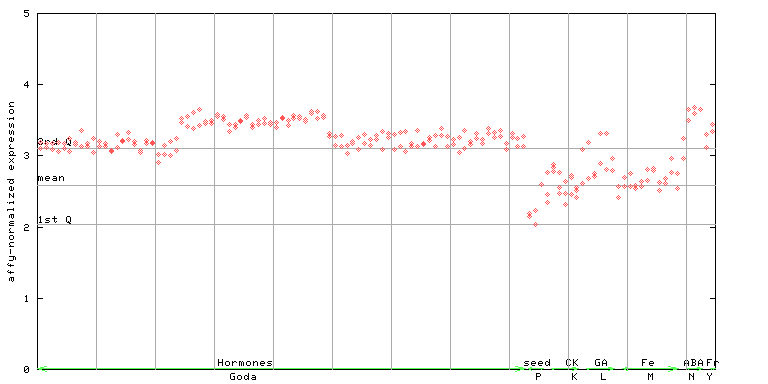
X axis is samples (xls file), and Y axis is log-expression. |
|||||||||||||||||||||||||


| Link to other DBs | ||
| Entrez Gene ID | 837730 |
|
| Refseq ID (protein) | NP_001184967.1 | |
| NP_001323381.1 | |
|
| NP_172647.2 | |
|
The preparation time of this page was 0.1 [sec].