[←][→] ath
| functional annotation | ||||||||||||||||||||||||||||||||||||||||||||||||||||
| Function | HCP-like superfamily protein |


|
||||||||||||||||||||||||||||||||||||||||||||||||||
| GO BP |
|
|||||||||||||||||||||||||||||||||||||||||||||||||||
| GO CC |
|
|||||||||||||||||||||||||||||||||||||||||||||||||||
| GO MF |
|
|||||||||||||||||||||||||||||||||||||||||||||||||||
| KEGG | ath04141 [list] [network] Protein processing in endoplasmic reticulum (211 genes) |  |
||||||||||||||||||||||||||||||||||||||||||||||||||
| Protein | NP_564049.1 | |||||||||||||||||||||||||||||||||||||||||||||||||||
| BLAST | NP_564049.1 | |||||||||||||||||||||||||||||||||||||||||||||||||||
| Orthologous | [Ortholog page] LOC732556 (gma) AT1G73570 (ath) LOC4332310 (osa) LOC7474823 (ppo) LOC7493488 (ppo) LOC11415768 (mtr) LOC100256050 (vvi) LOC100787823 (gma) LOC101243872 (sly) LOC103633963 (zma) LOC103639339 (zma) LOC103872588 (bra) | |||||||||||||||||||||||||||||||||||||||||||||||||||
| Subcellular localization wolf |
|
|||||||||||||||||||||||||||||||||||||||||||||||||||
| Subcellular localization TargetP |
|
|||||||||||||||||||||||||||||||||||||||||||||||||||
| Gene coexpression | ||||||||||||||||||||||||||||||||||||||||||||||||||||
| Network*for coexpressed genes |
|
|||||||||||||||||||||||||||||||||||||||||||||||||||
|---|---|---|---|---|---|---|---|---|---|---|---|---|---|---|---|---|---|---|---|---|---|---|---|---|---|---|---|---|---|---|---|---|---|---|---|---|---|---|---|---|---|---|---|---|---|---|---|---|---|---|---|---|
| Coexpressed gene list |
[Coexpressed gene list for EBS5] | |||||||||||||||||||||||||||||||||||||||||||||||||||
| Gene expression | ||||||||||||||||||||||||||||||||||||||||||||||||||||
| All samples | [Expression pattern for all samples] | |||||||||||||||||||||||||||||||||||||||||||||||||||
| AtGenExpress* (Development) |
256074_at
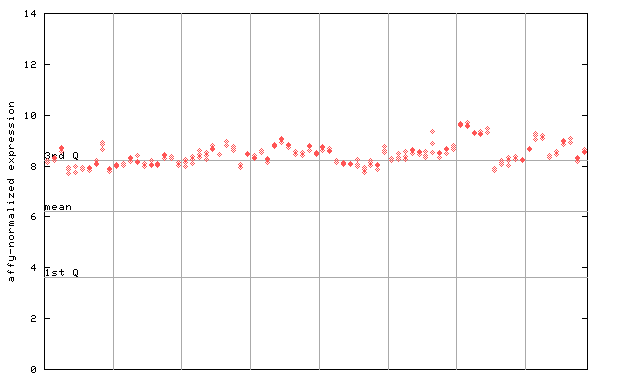
X axis is samples (pdf file), and Y axis is log2-expression. |
|||||||||||||||||||||||||||||||||||||||||||||||||||
| AtGenExpress* (Stress) |
256074_at
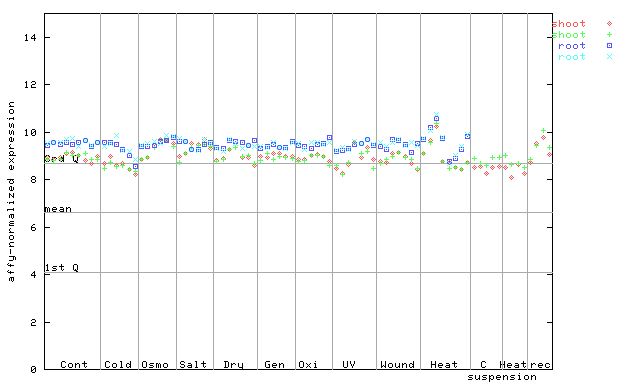
X axis is samples (pdf file), and Y axis is log2-expression. |
|||||||||||||||||||||||||||||||||||||||||||||||||||
| AtGenExpress* (Hormone) |
256074_at
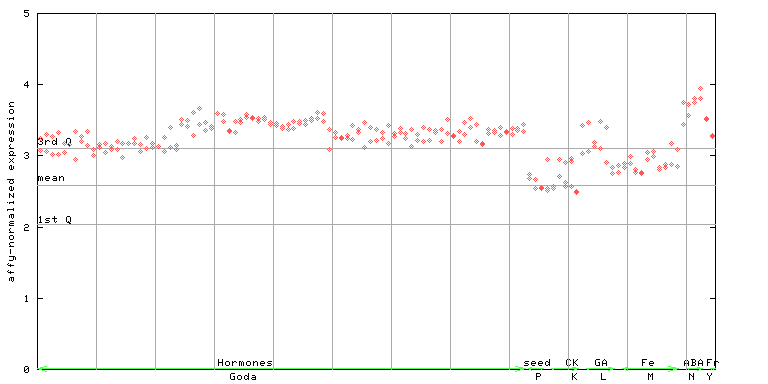
X axis is samples (xls file), and Y axis is log-expression. |
|||||||||||||||||||||||||||||||||||||||||||||||||||


")
")
")
| Link to other DBs | ||
| Entrez Gene ID | 838406 |
|
| Refseq ID (protein) | NP_564049.1 | |
The preparation time of this page was 0.2 [sec].