[←][→] ath
| functional annotation | ||||||||||||||||||||||||||
| Function | Exostosin family protein |


|
||||||||||||||||||||||||
| GO BP |
|
|||||||||||||||||||||||||
| GO CC |
|
|||||||||||||||||||||||||
| GO MF |
|
|||||||||||||||||||||||||
| KEGG | ||||||||||||||||||||||||||
| Protein | NP_564141.1 NP_973879.1 | |||||||||||||||||||||||||
| BLAST | NP_564141.1 NP_973879.1 | |||||||||||||||||||||||||
| Orthologous | [Ortholog page] LOC7467836 (ppo) LOC7492444 (ppo) LOC25482419 (mtr) LOC100814029 (gma) LOC101260338 (sly) LOC103835745 (bra) LOC103872984 (bra) LOC123088081 (tae) LOC123147860 (tae) LOC123163724 (tae) LOC123413619 (hvu) | |||||||||||||||||||||||||
| Subcellular localization wolf |
|
|||||||||||||||||||||||||
| Subcellular localization TargetP |
|
|||||||||||||||||||||||||
| Gene coexpression | ||||||||||||||||||||||||||
| Network*for coexpressed genes |
|
|||||||||||||||||||||||||
|---|---|---|---|---|---|---|---|---|---|---|---|---|---|---|---|---|---|---|---|---|---|---|---|---|---|---|
| Coexpressed gene list |
[Coexpressed gene list for AT1G21480] | |||||||||||||||||||||||||
| Gene expression | ||||||||||||||||||||||||||
| All samples | [Expression pattern for all samples] | |||||||||||||||||||||||||
| AtGenExpress* (Development) |
260879_at
X axis is samples (pdf file), and Y axis is log2-expression. |
|||||||||||||||||||||||||
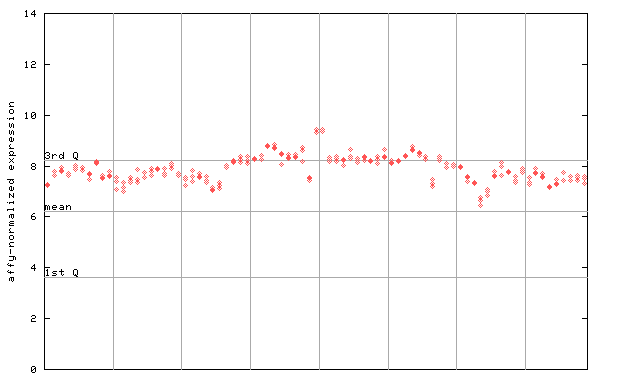
| AtGenExpress* (Stress) |
260879_at
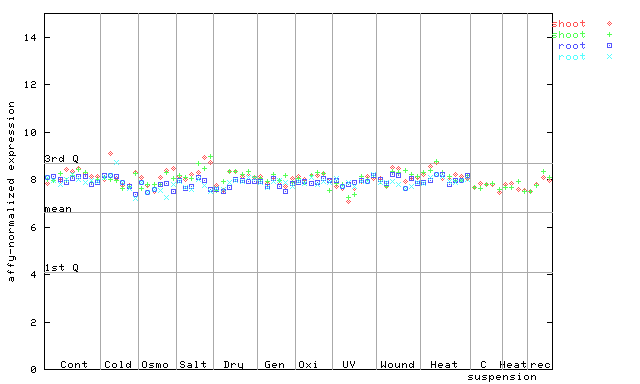
X axis is samples (pdf file), and Y axis is log2-expression. |
|||||||||||||||||||||||||
| AtGenExpress* (Hormone) |
260879_at
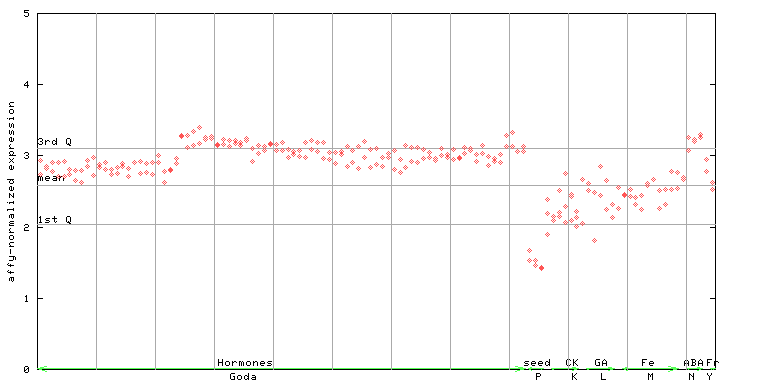
X axis is samples (xls file), and Y axis is log-expression. |
|||||||||||||||||||||||||


| Link to other DBs | ||
| Entrez Gene ID | 838746 |
|
| Refseq ID (protein) | NP_564141.1 | |
| NP_973879.1 | |
|
The preparation time of this page was 0.1 [sec].