[←][→] ath
| functional annotation | ||||||||||||||||||
| Function | sulfate transporter 91 |


|
||||||||||||||||
| GO BP |
|
|||||||||||||||||
| GO CC |
|
|||||||||||||||||
| GO MF |
|
|||||||||||||||||
| KEGG | ||||||||||||||||||
| Protein | NP_001320230.1 NP_001320231.1 NP_001320232.1 NP_173722.1 | |||||||||||||||||
| BLAST | NP_001320230.1 NP_001320231.1 NP_001320232.1 NP_173722.1 | |||||||||||||||||
| Orthologous | [Ortholog page] LOC4337235 (osa) LOC25492995 (mtr) LOC25492997 (mtr) LOC100256148 (vvi) LOC100383552 (zma) LOC100779433 (gma) LOC100787284 (gma) LOC100819130 (gma) LOC101250213 (sly) LOC103829293 (bra) LOC103840798 (bra) | |||||||||||||||||
| Subcellular localization wolf |
|
|||||||||||||||||
| Subcellular localization TargetP |
|
|||||||||||||||||
| Gene coexpression | ||||||||||||||||||
| Network*for coexpressed genes |
||||||||||||||||||
|---|---|---|---|---|---|---|---|---|---|---|---|---|---|---|---|---|---|---|
| Coexpressed gene list |
[Coexpressed gene list for AST91] | |||||||||||||||||
| Gene expression | ||||||||||||||||||
| All samples | [Expression pattern for all samples] | |||||||||||||||||
| AtGenExpress* (Development) |
264901_at
X axis is samples (pdf file), and Y axis is log2-expression. |
|||||||||||||||||
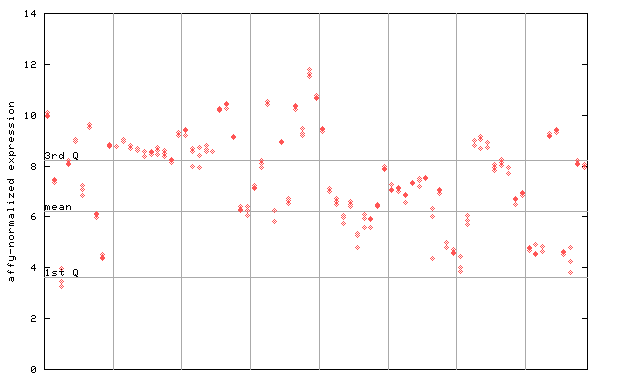
| AtGenExpress* (Stress) |
264901_at
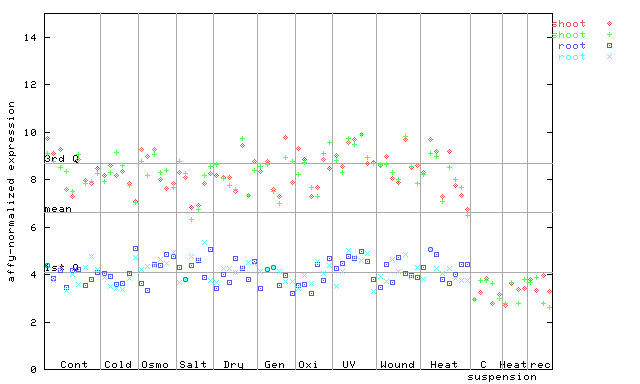
X axis is samples (pdf file), and Y axis is log2-expression. |
|||||||||||||||||
| AtGenExpress* (Hormone) |
264901_at
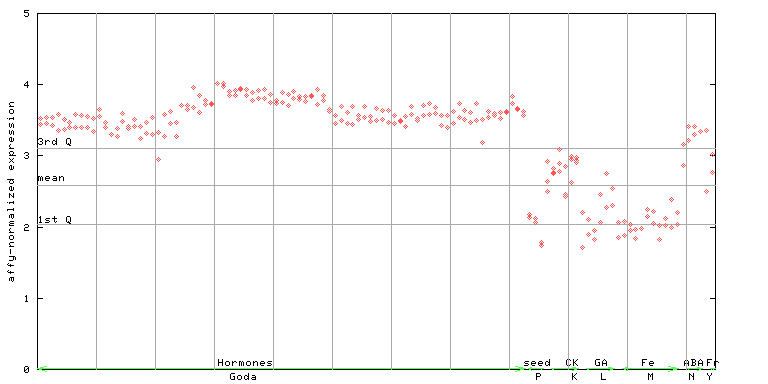
X axis is samples (xls file), and Y axis is log-expression. |
|||||||||||||||||


| Link to other DBs | ||
| Entrez Gene ID | 838917 |
|
| Refseq ID (protein) | NP_001320230.1 | |
| NP_001320231.1 | |
|
| NP_001320232.1 | |
|
| NP_173722.1 | |
|
The preparation time of this page was 0.2 [sec].