[←][→] ath
| functional annotation | |||||||||||||||||||||||||||||||
| Function | Six-hairpin glycosidases superfamily protein |


|
|||||||||||||||||||||||||||||
| GO BP |
|
||||||||||||||||||||||||||||||
| GO CC |
|
||||||||||||||||||||||||||||||
| GO MF |
|
||||||||||||||||||||||||||||||
| KEGG | ath00510 [list] [network] N-Glycan biosynthesis (45 genes) |  |
|||||||||||||||||||||||||||||
| ath04141 [list] [network] Protein processing in endoplasmic reticulum (211 genes) | |
||||||||||||||||||||||||||||||
| Protein | NP_001321649.1 NP_173842.2 | ||||||||||||||||||||||||||||||
| BLAST | NP_001321649.1 NP_173842.2 | ||||||||||||||||||||||||||||||
| Orthologous | [Ortholog page] GCS1 (ath) LOC4327748 (osa) LOC7477030 (ppo) LOC25501727 (mtr) LOC25501732 (mtr) LOC100264375 (vvi) LOC100795161 (gma) LOC100795691 (gma) LOC101267114 (sly) LOC103652327 (zma) LOC103829083 (bra) LOC103831024 (bra) | ||||||||||||||||||||||||||||||
| Subcellular localization wolf |
|
||||||||||||||||||||||||||||||
| Subcellular localization TargetP |
|
||||||||||||||||||||||||||||||
| Gene coexpression | |||||||||||||||||||||||||||||||
| Network*for coexpressed genes |
|
||||||||||||||||||||||||||||||
|---|---|---|---|---|---|---|---|---|---|---|---|---|---|---|---|---|---|---|---|---|---|---|---|---|---|---|---|---|---|---|---|
| Coexpressed gene list |
[Coexpressed gene list for AT1G24320] | ||||||||||||||||||||||||||||||
| Gene expression | |||||||||||||||||||||||||||||||
| All samples | [Expression pattern for all samples] | ||||||||||||||||||||||||||||||
| AtGenExpress* (Development) |
264861_at
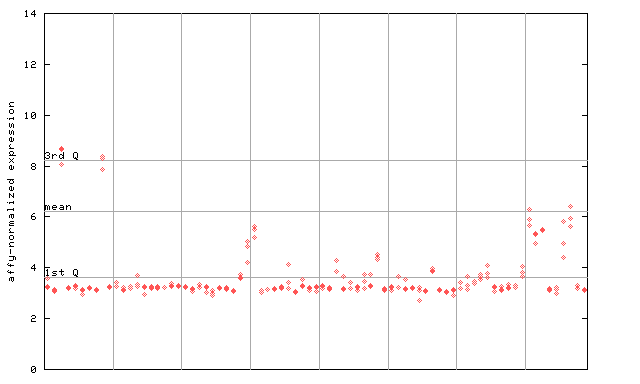
X axis is samples (pdf file), and Y axis is log2-expression. |
||||||||||||||||||||||||||||||
| AtGenExpress* (Stress) |
264861_at
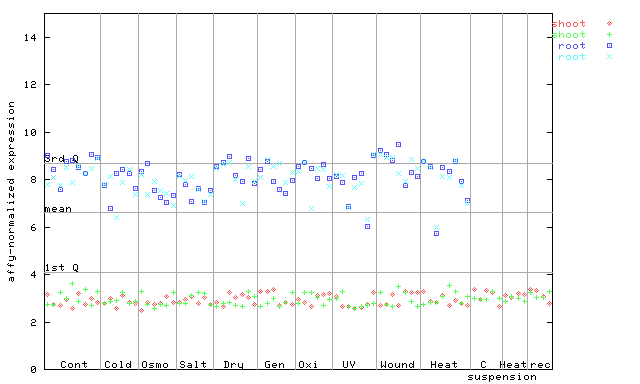
X axis is samples (pdf file), and Y axis is log2-expression. |
||||||||||||||||||||||||||||||
| AtGenExpress* (Hormone) |
264861_at
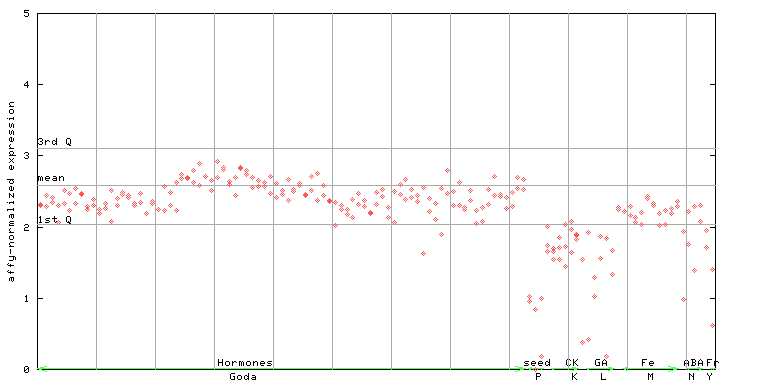
X axis is samples (xls file), and Y axis is log-expression. |
||||||||||||||||||||||||||||||


| Link to other DBs | ||
| Entrez Gene ID | 839048 |
|
| Refseq ID (protein) | NP_001321649.1 | |
| NP_173842.2 | |
|
The preparation time of this page was 0.2 [sec].