[←][→] ath
| functional annotation | ||||||||||||||||||||||||||||||||||||||||||||
| Function | P-glycoprotein 13 |


|
||||||||||||||||||||||||||||||||||||||||||
| GO BP |
|
|||||||||||||||||||||||||||||||||||||||||||
| GO CC |
|
|||||||||||||||||||||||||||||||||||||||||||
| GO MF |
|
|||||||||||||||||||||||||||||||||||||||||||
| KEGG | ath02010 [list] [network] ABC transporters (68 genes) |  |
||||||||||||||||||||||||||||||||||||||||||
| Protein | NP_001322427.1 NP_174115.1 | |||||||||||||||||||||||||||||||||||||||||||
| BLAST | NP_001322427.1 NP_174115.1 | |||||||||||||||||||||||||||||||||||||||||||
| Orthologous | [Ortholog page] ABCB14 (ath) LOC7496915 (ppo) LOC11422766 (mtr) LOC100787093 (gma) LOC100788391 (gma) LOC103839000 (bra) LOC103839008 (bra) | |||||||||||||||||||||||||||||||||||||||||||
| Subcellular localization wolf |
|
|||||||||||||||||||||||||||||||||||||||||||
| Subcellular localization TargetP |
|
|||||||||||||||||||||||||||||||||||||||||||
| Gene coexpression | ||||||||||||||||||||||||||||||||||||||||||||
| Network*for coexpressed genes |
|
|||||||||||||||||||||||||||||||||||||||||||
|---|---|---|---|---|---|---|---|---|---|---|---|---|---|---|---|---|---|---|---|---|---|---|---|---|---|---|---|---|---|---|---|---|---|---|---|---|---|---|---|---|---|---|---|---|
| Coexpressed gene list |
[Coexpressed gene list for ABCB13] | |||||||||||||||||||||||||||||||||||||||||||
| Gene expression | ||||||||||||||||||||||||||||||||||||||||||||
| All samples | [Expression pattern for all samples] | |||||||||||||||||||||||||||||||||||||||||||
| AtGenExpress* (Development) |
259607_at
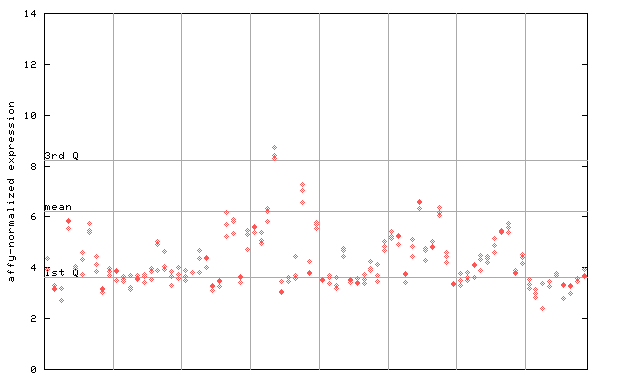
X axis is samples (pdf file), and Y axis is log2-expression. |
|||||||||||||||||||||||||||||||||||||||||||
| AtGenExpress* (Stress) |
259607_at
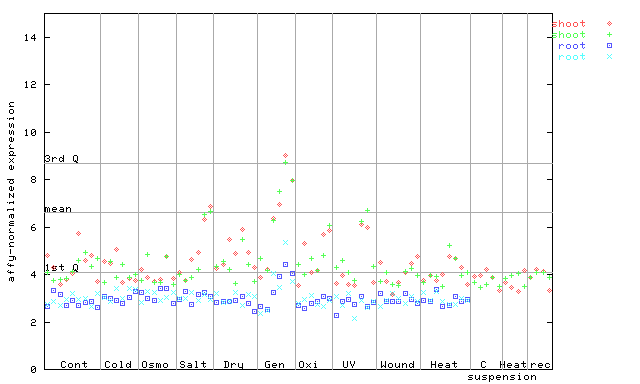
X axis is samples (pdf file), and Y axis is log2-expression. |
|||||||||||||||||||||||||||||||||||||||||||
| AtGenExpress* (Hormone) |
259607_at
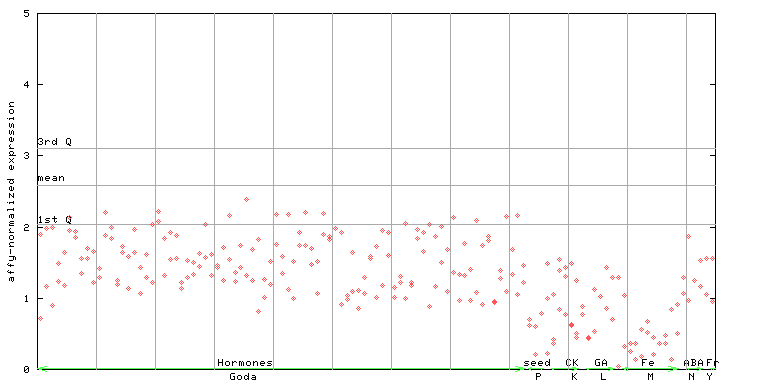
X axis is samples (xls file), and Y axis is log-expression. |
|||||||||||||||||||||||||||||||||||||||||||


")
| Link to other DBs | ||
| Entrez Gene ID | 839687 |
|
| Refseq ID (protein) | NP_001322427.1 | |
| NP_174115.1 | |
|
The preparation time of this page was 0.2 [sec].