[←][→] ath
| functional annotation | ||||||||||||||||||||||||||||||||||
| Function | transcriptional regulator family protein |


|
||||||||||||||||||||||||||||||||
| GO BP |
|
|||||||||||||||||||||||||||||||||
| GO CC |
|
|||||||||||||||||||||||||||||||||
| GO MF |
|
|||||||||||||||||||||||||||||||||
| KEGG | ||||||||||||||||||||||||||||||||||
| Protein | NP_001185111.1 NP_564324.1 | |||||||||||||||||||||||||||||||||
| BLAST | NP_001185111.1 NP_564324.1 | |||||||||||||||||||||||||||||||||
| Orthologous | [Ortholog page] LOC7472296 (ppo) LOC7476332 (ppo) LOC9270029 (osa) LOC11412455 (mtr) LOC100527074 (gma) LOC100792733 (gma) LOC101245911 (sly) LOC103840506 (bra) LOC123062116 (tae) LOC123070841 (tae) LOC123079232 (tae) LOC123444456 (hvu) | |||||||||||||||||||||||||||||||||
| Subcellular localization wolf |
|
|||||||||||||||||||||||||||||||||
| Subcellular localization TargetP |
|
|||||||||||||||||||||||||||||||||
| Gene coexpression | ||||||||||||||||||||||||||||||||||
| Network*for coexpressed genes |
|
|||||||||||||||||||||||||||||||||
|---|---|---|---|---|---|---|---|---|---|---|---|---|---|---|---|---|---|---|---|---|---|---|---|---|---|---|---|---|---|---|---|---|---|---|
| Coexpressed gene list |
[Coexpressed gene list for AT1G29220] | |||||||||||||||||||||||||||||||||
| Gene expression | ||||||||||||||||||||||||||||||||||
| All samples | [Expression pattern for all samples] | |||||||||||||||||||||||||||||||||
| AtGenExpress* (Development) |
260894_at
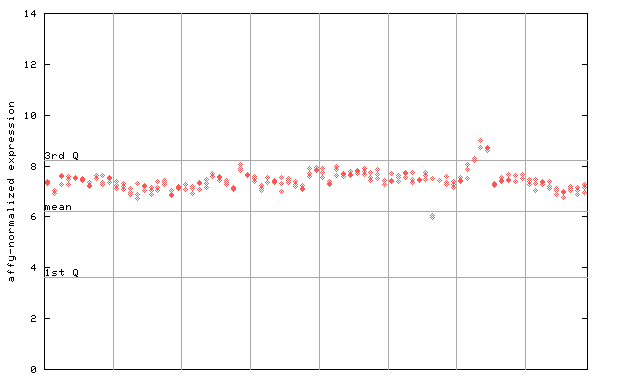
X axis is samples (pdf file), and Y axis is log2-expression. |
|||||||||||||||||||||||||||||||||
| AtGenExpress* (Stress) |
260894_at
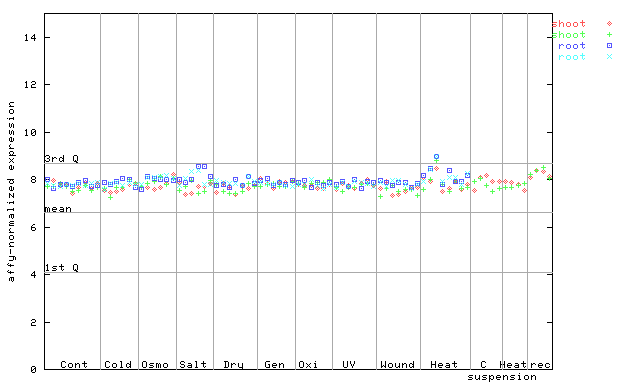
X axis is samples (pdf file), and Y axis is log2-expression. |
|||||||||||||||||||||||||||||||||
| AtGenExpress* (Hormone) |
260894_at
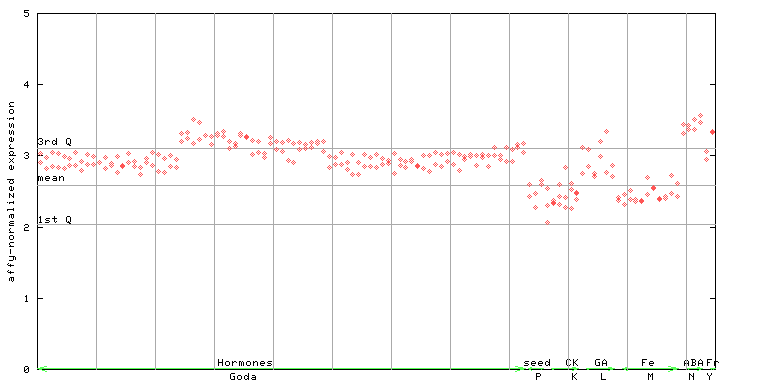
X axis is samples (xls file), and Y axis is log-expression. |
|||||||||||||||||||||||||||||||||


")
| Link to other DBs | ||
| Entrez Gene ID | 839796 |
|
| Refseq ID (protein) | NP_001185111.1 | |
| NP_564324.1 | |
|
The preparation time of this page was 0.2 [sec].