[←][→] ath
| functional annotation | |||||||||||||||||||||||||||||||||||||||||
| Function | myo-inositol monophosphatase like 1 |

 Plant GARDEN Plant GARDEN JBrowse
|
|||||||||||||||||||||||||||||||||||||||
| GO BP |
|
||||||||||||||||||||||||||||||||||||||||
| GO CC |
|
||||||||||||||||||||||||||||||||||||||||
| GO MF |
|
||||||||||||||||||||||||||||||||||||||||
| KEGG | ath00562 [list] [network] Inositol phosphate metabolism (79 genes) |  |
|||||||||||||||||||||||||||||||||||||||
| ath04070 [list] [network] Phosphatidylinositol signaling system (77 genes) | |
||||||||||||||||||||||||||||||||||||||||
| Protein | NP_564376.1 | ||||||||||||||||||||||||||||||||||||||||
| BLAST | NP_564376.1 | ||||||||||||||||||||||||||||||||||||||||
| Orthologous | [Ortholog page] LOC4328439 (osa) LOC7476714 (ppo) LOC18103908 (ppo) LOC25480479 (mtr) LOC100796770 (gma) LOC101254658 (sly) LOC103840263 (bra) LOC112325746 (ppo) LOC123136657 (tae) LOC123144155 (tae) LOC123401412 (hvu) | ||||||||||||||||||||||||||||||||||||||||
| Subcellular localization wolf |
|
||||||||||||||||||||||||||||||||||||||||
| Subcellular localization TargetP |
|
||||||||||||||||||||||||||||||||||||||||
| Gene coexpression | |||||||||||||||||||||||||||||||||||||||||
| Network*for coexpressed genes |
|
||||||||||||||||||||||||||||||||||||||||
|---|---|---|---|---|---|---|---|---|---|---|---|---|---|---|---|---|---|---|---|---|---|---|---|---|---|---|---|---|---|---|---|---|---|---|---|---|---|---|---|---|---|
| Coexpressed gene list |
[Coexpressed gene list for IMPL1] | ||||||||||||||||||||||||||||||||||||||||
| Gene expression | |||||||||||||||||||||||||||||||||||||||||
| All samples | [Expression pattern for all samples] | ||||||||||||||||||||||||||||||||||||||||
| AtGenExpress* (Development) |
263705_at
X axis is samples (pdf file), and Y axis is log2-expression. |
||||||||||||||||||||||||||||||||||||||||
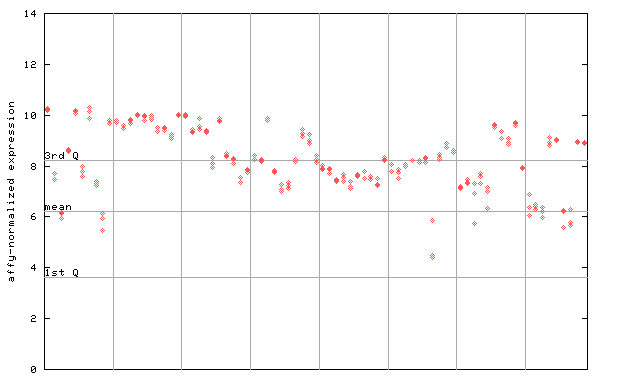
| AtGenExpress* (Stress) |
263705_at
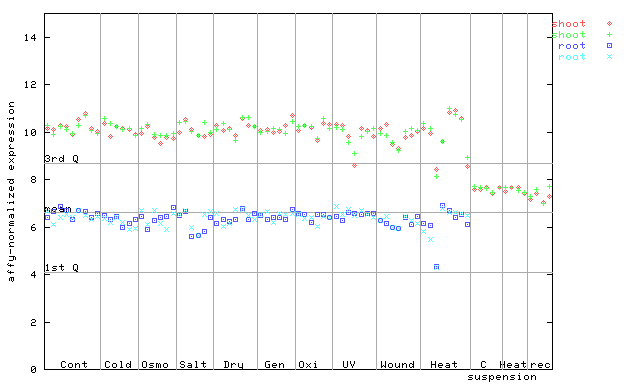
X axis is samples (pdf file), and Y axis is log2-expression. |
||||||||||||||||||||||||||||||||||||||||
| AtGenExpress* (Hormone) |
263705_at
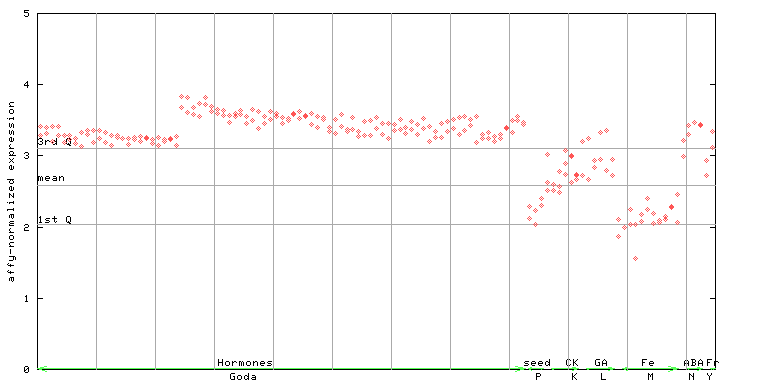
X axis is samples (xls file), and Y axis is log-expression. |
||||||||||||||||||||||||||||||||||||||||


| Link to other DBs | ||
| Entrez Gene ID | 840007 |
|
| Refseq ID (protein) | NP_564376.1 | |
The preparation time of this page was 0.1 [sec].