[←][→] ath
| functional annotation | ||||||||||||||||||||||||||||||||||||
| Function | hypothetical protein |


|
||||||||||||||||||||||||||||||||||
| GO BP |
|
|||||||||||||||||||||||||||||||||||
| GO CC |
|
|||||||||||||||||||||||||||||||||||
| GO MF |
|
|||||||||||||||||||||||||||||||||||
| KEGG | ||||||||||||||||||||||||||||||||||||
| Protein | NP_001117402.1 NP_001185128.1 NP_001319131.1 NP_001322228.1 NP_174581.1 NP_849743.2 | |||||||||||||||||||||||||||||||||||
| BLAST | NP_001117402.1 NP_001185128.1 NP_001319131.1 NP_001322228.1 NP_174581.1 NP_849743.2 | |||||||||||||||||||||||||||||||||||
| Orthologous | [Ortholog page] AT4G10470 (ath) LOC103833644 (bra) | |||||||||||||||||||||||||||||||||||
| Subcellular localization wolf |
|
|||||||||||||||||||||||||||||||||||
| Subcellular localization TargetP |
|
|||||||||||||||||||||||||||||||||||
| Gene coexpression | ||||||||||||||||||||||||||||||||||||
| Network*for coexpressed genes |
|
|||||||||||||||||||||||||||||||||||
|---|---|---|---|---|---|---|---|---|---|---|---|---|---|---|---|---|---|---|---|---|---|---|---|---|---|---|---|---|---|---|---|---|---|---|---|---|
| Coexpressed gene list |
[Coexpressed gene list for AT1G33050] | |||||||||||||||||||||||||||||||||||
| Gene expression | ||||||||||||||||||||||||||||||||||||
| All samples | [Expression pattern for all samples] | |||||||||||||||||||||||||||||||||||
| AtGenExpress* (Development) |
261615_at
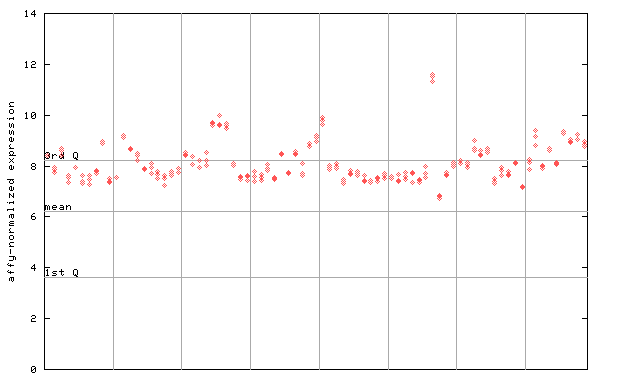
X axis is samples (pdf file), and Y axis is log2-expression. |
|||||||||||||||||||||||||||||||||||
| AtGenExpress* (Stress) |
261615_at
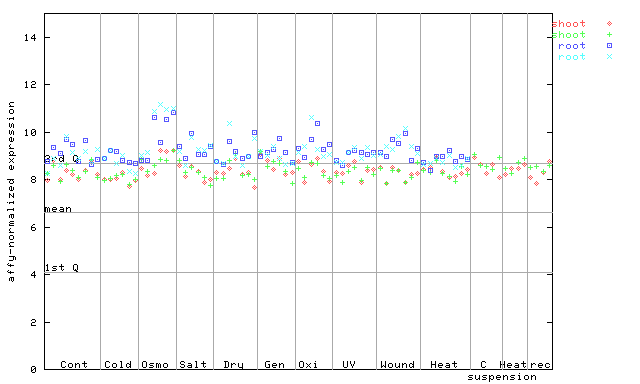
X axis is samples (pdf file), and Y axis is log2-expression. |
|||||||||||||||||||||||||||||||||||
| AtGenExpress* (Hormone) |
261615_at
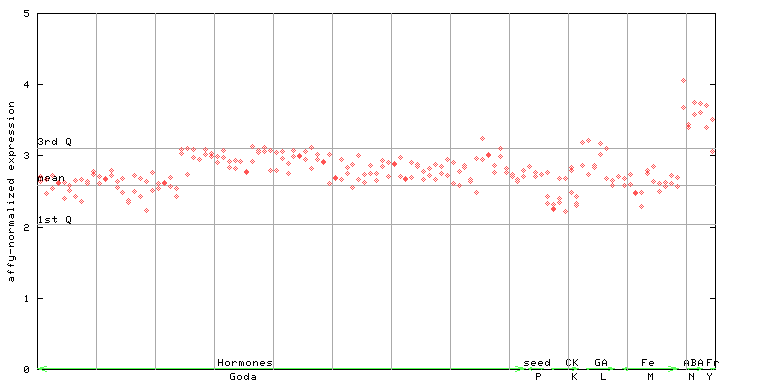
X axis is samples (xls file), and Y axis is log-expression. |
|||||||||||||||||||||||||||||||||||


| Link to other DBs | ||
| Entrez Gene ID | 840200 |
|
| Refseq ID (protein) | NP_001117402.1 | |
| NP_001185128.1 | |
|
| NP_001319131.1 | |
|
| NP_001322228.1 | |
|
| NP_174581.1 | |
|
| NP_849743.2 | |
|
The preparation time of this page was 0.2 [sec].