[←][→] ath
| functional annotation | |||||||||||||||||||||||||||||||||||||||
| Function | myotubularin-like protein |

 Plant GARDEN Plant GARDEN JBrowse
|
|||||||||||||||||||||||||||||||||||||
| GO BP |
|
||||||||||||||||||||||||||||||||||||||
| GO CC |
|
||||||||||||||||||||||||||||||||||||||
| GO MF |
|
||||||||||||||||||||||||||||||||||||||
| KEGG | |||||||||||||||||||||||||||||||||||||||
| Protein | NP_001185146.1 NP_564476.2 | ||||||||||||||||||||||||||||||||||||||
| BLAST | NP_001185146.1 NP_564476.2 | ||||||||||||||||||||||||||||||||||||||
| Orthologous | [Ortholog page] LOC7469121 (ppo) LOC7495121 (ppo) LOC11413109 (mtr) LOC11433517 (mtr) LOC100776177 (gma) LOC100800136 (gma) LOC100806174 (gma) LOC103849610 (bra) LOC104644498 (sly) | ||||||||||||||||||||||||||||||||||||||
| Subcellular localization wolf |
|
||||||||||||||||||||||||||||||||||||||
| Subcellular localization TargetP |
|
||||||||||||||||||||||||||||||||||||||
| Gene coexpression | |||||||||||||||||||||||||||||||||||||||
| Network*for coexpressed genes |
|
||||||||||||||||||||||||||||||||||||||
|---|---|---|---|---|---|---|---|---|---|---|---|---|---|---|---|---|---|---|---|---|---|---|---|---|---|---|---|---|---|---|---|---|---|---|---|---|---|---|---|
| Coexpressed gene list |
[Coexpressed gene list for AT1G36940] | ||||||||||||||||||||||||||||||||||||||
| Gene expression | |||||||||||||||||||||||||||||||||||||||
| All samples | [Expression pattern for all samples] | ||||||||||||||||||||||||||||||||||||||
| AtGenExpress* (Development) |
261292_at
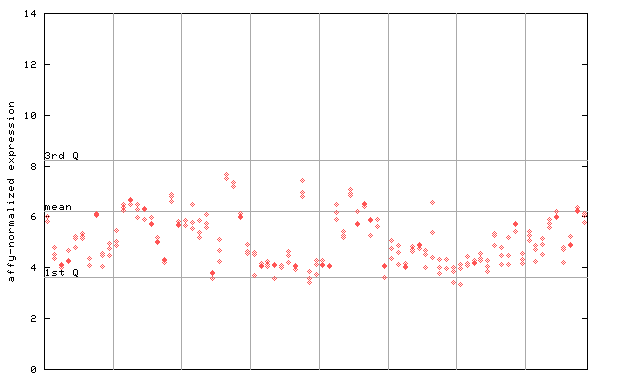
X axis is samples (pdf file), and Y axis is log2-expression. |
||||||||||||||||||||||||||||||||||||||
| AtGenExpress* (Stress) |
261292_at
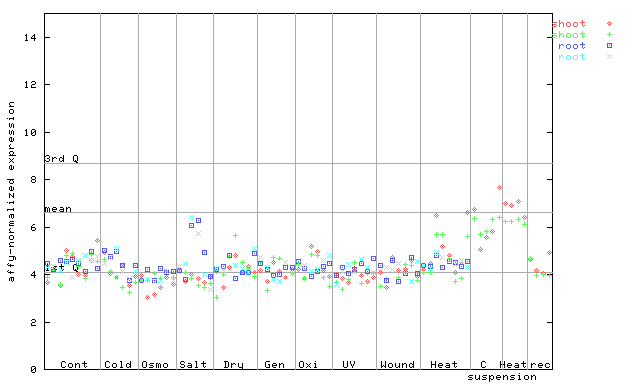
X axis is samples (pdf file), and Y axis is log2-expression. |
||||||||||||||||||||||||||||||||||||||
| AtGenExpress* (Hormone) |
261292_at
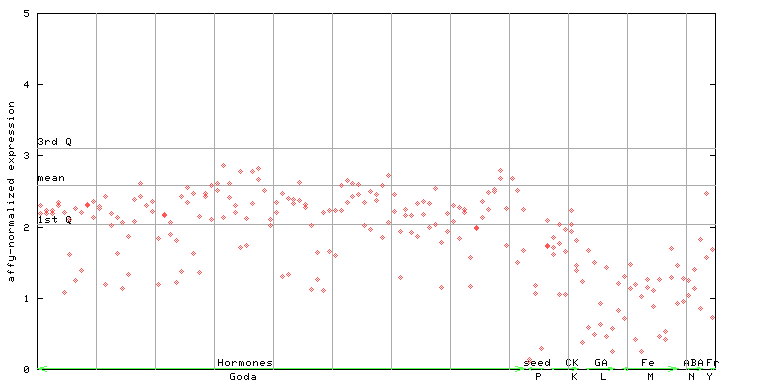
X axis is samples (xls file), and Y axis is log-expression. |
||||||||||||||||||||||||||||||||||||||


")
| Link to other DBs | ||
| Entrez Gene ID | 840603 |
|
| Refseq ID (protein) | NP_001185146.1 | |
| NP_564476.2 | |
|
The preparation time of this page was 0.5 [sec].