[←][→] ath
| functional annotation | ||||||||||||||||||||||||||||||||||||||||||||
| Function | Peroxidase superfamily protein |


|
||||||||||||||||||||||||||||||||||||||||||
| GO BP |
|
|||||||||||||||||||||||||||||||||||||||||||
| GO CC |
|
|||||||||||||||||||||||||||||||||||||||||||
| GO MF |
|
|||||||||||||||||||||||||||||||||||||||||||
| KEGG | ath00940 [list] [network] Phenylpropanoid biosynthesis (128 genes) |  |
||||||||||||||||||||||||||||||||||||||||||
| Protein | NP_175117.1 | |||||||||||||||||||||||||||||||||||||||||||
| BLAST | NP_175117.1 | |||||||||||||||||||||||||||||||||||||||||||
| Orthologous | [Ortholog page] LOC4325127 (osa) LOC7479718 (ppo) LOC11414547 (mtr) LOC100795020 (gma) LOC101264212 (sly) LOC101268099 (sly) LOC102660391 (gma) LOC103854363 (bra) LOC123061025 (tae) LOC123069609 (tae) LOC123443449 (hvu) | |||||||||||||||||||||||||||||||||||||||||||
| Subcellular localization wolf |
|
|||||||||||||||||||||||||||||||||||||||||||
| Subcellular localization TargetP |
|
|||||||||||||||||||||||||||||||||||||||||||
| Gene coexpression | ||||||||||||||||||||||||||||||||||||||||||||
| Network*for coexpressed genes |
|
|||||||||||||||||||||||||||||||||||||||||||
|---|---|---|---|---|---|---|---|---|---|---|---|---|---|---|---|---|---|---|---|---|---|---|---|---|---|---|---|---|---|---|---|---|---|---|---|---|---|---|---|---|---|---|---|---|
| Coexpressed gene list |
[Coexpressed gene list for AT1G44970] | |||||||||||||||||||||||||||||||||||||||||||
| Gene expression | ||||||||||||||||||||||||||||||||||||||||||||
| All samples | [Expression pattern for all samples] | |||||||||||||||||||||||||||||||||||||||||||
| AtGenExpress* (Development) |
260941_at
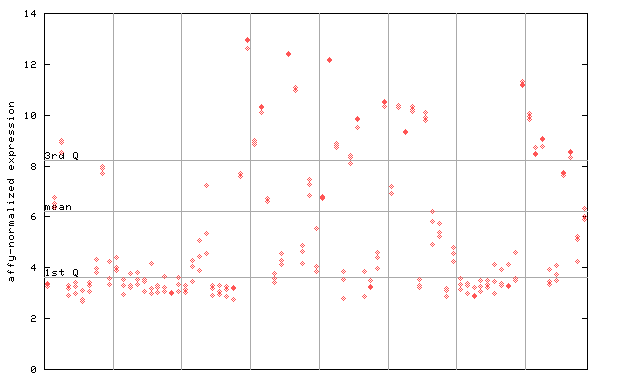
X axis is samples (pdf file), and Y axis is log2-expression. |
|||||||||||||||||||||||||||||||||||||||||||
| AtGenExpress* (Stress) |
260941_at
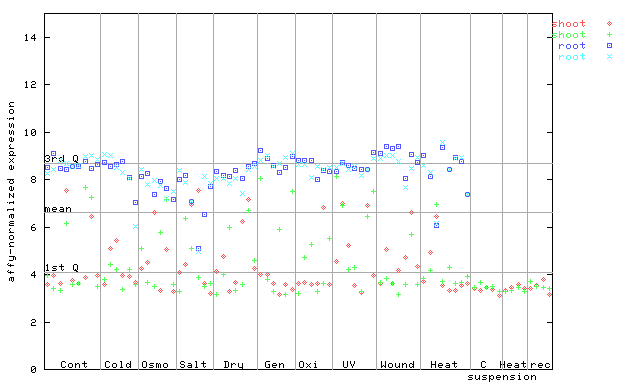
X axis is samples (pdf file), and Y axis is log2-expression. |
|||||||||||||||||||||||||||||||||||||||||||
| AtGenExpress* (Hormone) |
260941_at
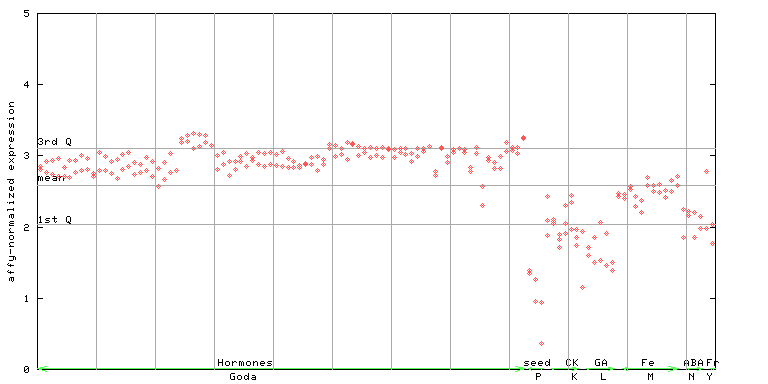
X axis is samples (xls file), and Y axis is log-expression. |
|||||||||||||||||||||||||||||||||||||||||||


")
| Link to other DBs | ||
| Entrez Gene ID | 841062 |
|
| Refseq ID (protein) | NP_175117.1 | |
The preparation time of this page was 0.1 [sec].