[←][→] ath
| functional annotation | |||||||||||||||||||||||||||||||||||||||||||||||
| Function | alpha-1,6-mannosyl-glycoprotein 2-beta-N-acetylglucosaminyltransferase |


|
|||||||||||||||||||||||||||||||||||||||||||||
| GO BP |
|
||||||||||||||||||||||||||||||||||||||||||||||
| GO CC |
|
||||||||||||||||||||||||||||||||||||||||||||||
| GO MF |
|
||||||||||||||||||||||||||||||||||||||||||||||
| KEGG | |||||||||||||||||||||||||||||||||||||||||||||||
| Protein | NP_175129.3 | ||||||||||||||||||||||||||||||||||||||||||||||
| BLAST | NP_175129.3 | ||||||||||||||||||||||||||||||||||||||||||||||
| Orthologous | [Ortholog page] LOC4343724 (osa) LOC7463396 (ppo) LOC25490180 (mtr) LOC100782659 (gma) LOC100799554 (gma) LOC101254789 (sly) LOC103833117 (bra) LOC123044425 (tae) LOC123052288 (tae) LOC123188112 (tae) LOC123425565 (hvu) | ||||||||||||||||||||||||||||||||||||||||||||||
| Subcellular localization wolf |
|
||||||||||||||||||||||||||||||||||||||||||||||
| Subcellular localization TargetP |
|
||||||||||||||||||||||||||||||||||||||||||||||
| Gene coexpression | |||||||||||||||||||||||||||||||||||||||||||||||
| Network*for coexpressed genes |
|
||||||||||||||||||||||||||||||||||||||||||||||
|---|---|---|---|---|---|---|---|---|---|---|---|---|---|---|---|---|---|---|---|---|---|---|---|---|---|---|---|---|---|---|---|---|---|---|---|---|---|---|---|---|---|---|---|---|---|---|---|
| Coexpressed gene list |
[Coexpressed gene list for AT1G45150] | ||||||||||||||||||||||||||||||||||||||||||||||
| Gene expression | |||||||||||||||||||||||||||||||||||||||||||||||
| All samples | [Expression pattern for all samples] | ||||||||||||||||||||||||||||||||||||||||||||||
| AtGenExpress* (Development) |
260936_at
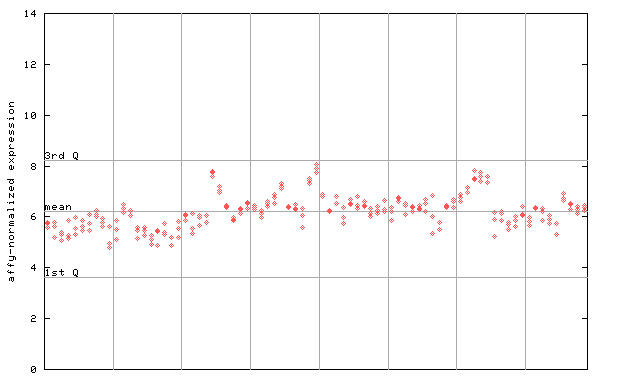
X axis is samples (pdf file), and Y axis is log2-expression. |
||||||||||||||||||||||||||||||||||||||||||||||
| AtGenExpress* (Stress) |
260936_at
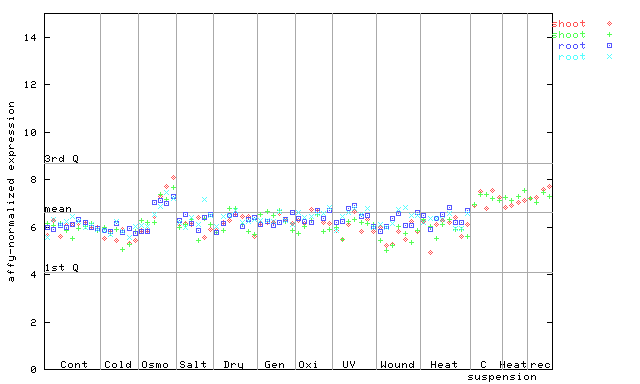
X axis is samples (pdf file), and Y axis is log2-expression. |
||||||||||||||||||||||||||||||||||||||||||||||
| AtGenExpress* (Hormone) |
260936_at
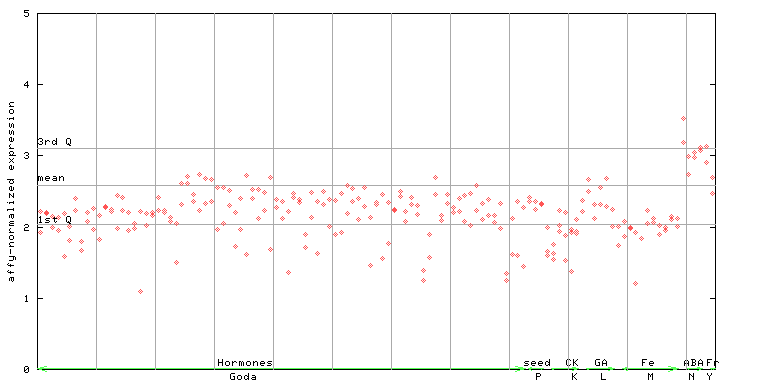
X axis is samples (xls file), and Y axis is log-expression. |
||||||||||||||||||||||||||||||||||||||||||||||


")
")
")
| Link to other DBs | ||
| Entrez Gene ID | 841083 |
|
| Refseq ID (protein) | NP_175129.3 | |
The preparation time of this page was 0.1 [sec].