[←][→] ath
| functional annotation | |||||||||||||||||||||||||||||||||||||||||||||||
| Function | S-methyl-5-thioribose kinase |


|
|||||||||||||||||||||||||||||||||||||||||||||
| GO BP |
|
||||||||||||||||||||||||||||||||||||||||||||||
| GO CC |
|
||||||||||||||||||||||||||||||||||||||||||||||
| GO MF |
|
||||||||||||||||||||||||||||||||||||||||||||||
| KEGG | ath00270 [list] [network] Cysteine and methionine metabolism (121 genes) |  |
|||||||||||||||||||||||||||||||||||||||||||||
| Protein | NP_564555.1 | ||||||||||||||||||||||||||||||||||||||||||||||
| BLAST | NP_564555.1 | ||||||||||||||||||||||||||||||||||||||||||||||
| Orthologous | [Ortholog page] LOC4337347 (osa) LOC7492068 (ppo) LOC25485383 (mtr) LOC100242426 (vvi) LOC100264709 (vvi) LOC100283015 (zma) LOC100807564 (gma) LOC100818359 (gma) LOC101249769 (sly) LOC103871404 (bra) LOC107276080 (osa) | ||||||||||||||||||||||||||||||||||||||||||||||
| Subcellular localization wolf |
|
||||||||||||||||||||||||||||||||||||||||||||||
| Subcellular localization TargetP |
|
||||||||||||||||||||||||||||||||||||||||||||||
| Gene coexpression | |||||||||||||||||||||||||||||||||||||||||||||||
| Network*for coexpressed genes |
|
||||||||||||||||||||||||||||||||||||||||||||||
|---|---|---|---|---|---|---|---|---|---|---|---|---|---|---|---|---|---|---|---|---|---|---|---|---|---|---|---|---|---|---|---|---|---|---|---|---|---|---|---|---|---|---|---|---|---|---|---|
| Coexpressed gene list |
[Coexpressed gene list for MTK] | ||||||||||||||||||||||||||||||||||||||||||||||
| Gene expression | |||||||||||||||||||||||||||||||||||||||||||||||
| All samples | [Expression pattern for all samples] | ||||||||||||||||||||||||||||||||||||||||||||||
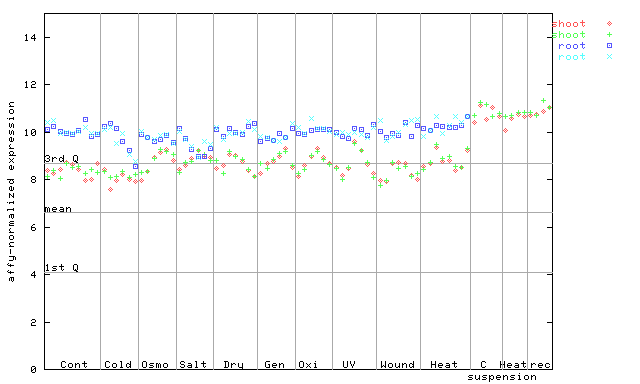
| AtGenExpress* (Development) |
259819_at
X axis is samples (pdf file), and Y axis is log2-expression. |
||||||||||||||||||||||||||||||||||||||||||||||
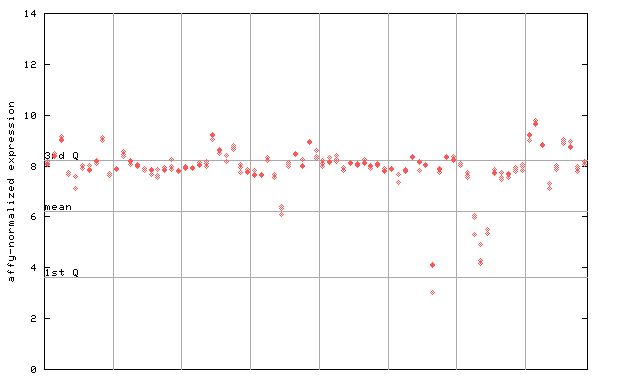
| AtGenExpress* (Stress) |
259819_at
X axis is samples (pdf file), and Y axis is log2-expression. |
||||||||||||||||||||||||||||||||||||||||||||||
| AtGenExpress* (Hormone) |
259819_at
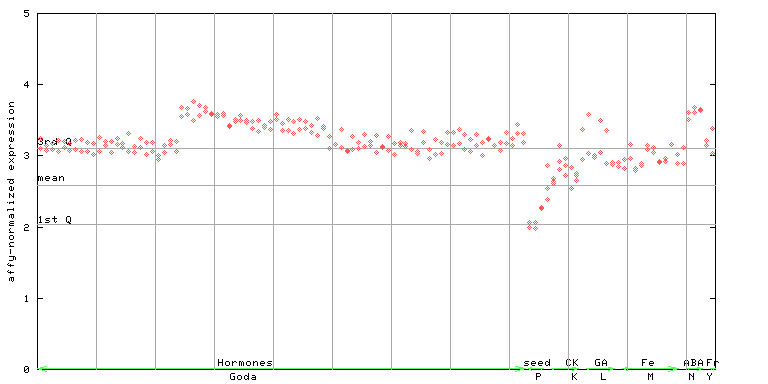
X axis is samples (xls file), and Y axis is log-expression. |
||||||||||||||||||||||||||||||||||||||||||||||


")
")
")
| Link to other DBs | ||
| Entrez Gene ID | 841405 |
|
| Refseq ID (protein) | NP_564555.1 | |
The preparation time of this page was 0.2 [sec].