[←][→] ath
| functional annotation | |||||||||||||||||||||||||||||||
| Function | tubulin alpha-6 chain |


|
|||||||||||||||||||||||||||||
| GO BP |
|
||||||||||||||||||||||||||||||
| GO CC |
|
||||||||||||||||||||||||||||||
| GO MF |
|
||||||||||||||||||||||||||||||
| KEGG | |||||||||||||||||||||||||||||||
| Protein | NP_175424.1 | ||||||||||||||||||||||||||||||
| BLAST | NP_175424.1 | ||||||||||||||||||||||||||||||
| Orthologous | [Ortholog page] LOC7469652 (ppo) LOC7470761 (ppo) LOC9272501 (osa) LOC25485306 (mtr) LOC100305745 (gma) LOC100797764 (gma) LOC101259889 (sly) LOC103832899 (bra) LOC103871370 (bra) LOC123086071 (tae) LOC123092152 (tae) LOC123097348 (tae) | ||||||||||||||||||||||||||||||
| Subcellular localization wolf |
|
||||||||||||||||||||||||||||||
| Subcellular localization TargetP |
|
||||||||||||||||||||||||||||||
| Gene coexpression | |||||||||||||||||||||||||||||||
| Network*for coexpressed genes |
|
||||||||||||||||||||||||||||||
|---|---|---|---|---|---|---|---|---|---|---|---|---|---|---|---|---|---|---|---|---|---|---|---|---|---|---|---|---|---|---|---|
| Coexpressed gene list |
[Coexpressed gene list for AT1G50020] | ||||||||||||||||||||||||||||||
| Gene expression | |||||||||||||||||||||||||||||||
| All samples | [Expression pattern for all samples] | ||||||||||||||||||||||||||||||
| AtGenExpress* (Development) |
261635_at
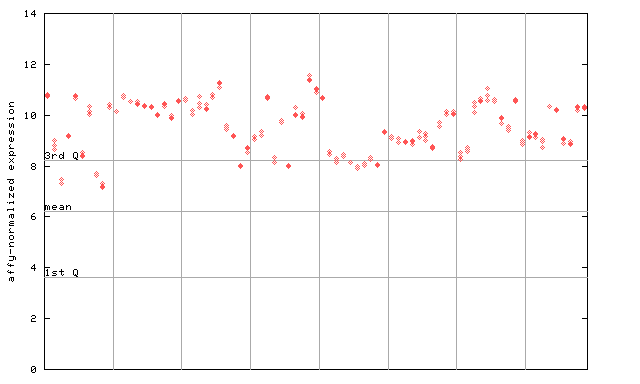
X axis is samples (pdf file), and Y axis is log2-expression. |
||||||||||||||||||||||||||||||
| AtGenExpress* (Stress) |
261635_at
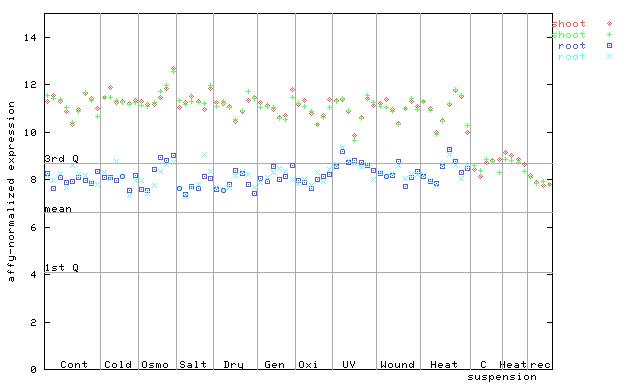
X axis is samples (pdf file), and Y axis is log2-expression. |
||||||||||||||||||||||||||||||
| AtGenExpress* (Hormone) |
261635_at
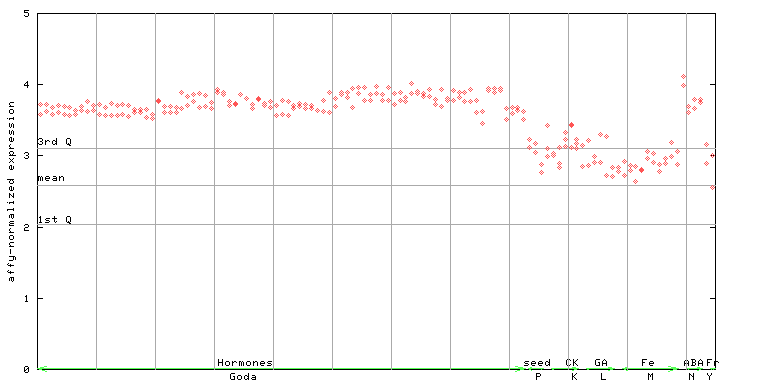
X axis is samples (xls file), and Y axis is log-expression. |
||||||||||||||||||||||||||||||


| Link to other DBs | ||
| Entrez Gene ID | 841426 |
|
| Refseq ID (protein) | NP_175424.1 | |
The preparation time of this page was 0.1 [sec].