[←][→] ath
| functional annotation | ||||||||||||||||||||||||||||||||
| Function | vesicle-associated protein 1-4 |


|
||||||||||||||||||||||||||||||
| GO BP |
|
|||||||||||||||||||||||||||||||
| GO CC |
|
|||||||||||||||||||||||||||||||
| GO MF |
|
|||||||||||||||||||||||||||||||
| KEGG | ||||||||||||||||||||||||||||||||
| Protein | NP_001077695.4 NP_001154418.1 NP_001319192.1 NP_001319193.1 NP_001321256.1 NP_001321257.1 NP_001321258.1 NP_001321259.1 NP_001321260.1 NP_001321261.1 NP_001321262.1 NP_001321263.1 NP_001321264.1 NP_001321265.1 NP_175538.3 | |||||||||||||||||||||||||||||||
| BLAST | NP_001077695.4 NP_001154418.1 NP_001319192.1 NP_001319193.1 NP_001321256.1 NP_001321257.1 NP_001321258.1 NP_001321259.1 NP_001321260.1 NP_001321261.1 NP_001321262.1 NP_001321263.1 NP_001321264.1 NP_001321265.1 NP_175538.3 | |||||||||||||||||||||||||||||||
| Orthologous | ||||||||||||||||||||||||||||||||
| Subcellular localization wolf |
|
|||||||||||||||||||||||||||||||
| Subcellular localization TargetP |
|
|||||||||||||||||||||||||||||||
| Gene coexpression | ||||||||||||||||||||||||||||||||
| Network*for coexpressed genes |
||||||||||||||||||||||||||||||||
|---|---|---|---|---|---|---|---|---|---|---|---|---|---|---|---|---|---|---|---|---|---|---|---|---|---|---|---|---|---|---|---|---|
| Coexpressed gene list |
[Coexpressed gene list for AT1G51270] | |||||||||||||||||||||||||||||||
| Gene expression | ||||||||||||||||||||||||||||||||
| All samples | [Expression pattern for all samples] | |||||||||||||||||||||||||||||||
| AtGenExpress* (Development) |
265136_at
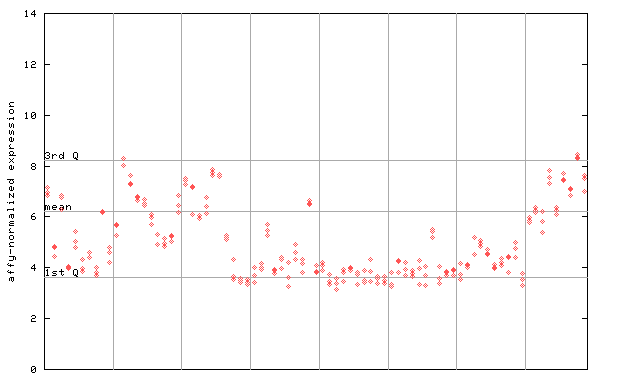
X axis is samples (pdf file), and Y axis is log2-expression. |
|||||||||||||||||||||||||||||||
| AtGenExpress* (Stress) |
265136_at
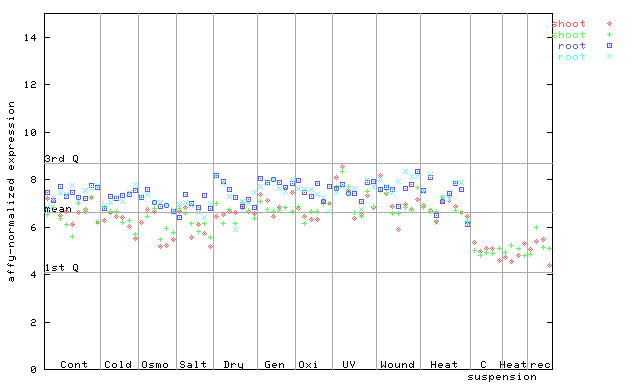
X axis is samples (pdf file), and Y axis is log2-expression. |
|||||||||||||||||||||||||||||||
| AtGenExpress* (Hormone) |
265136_at
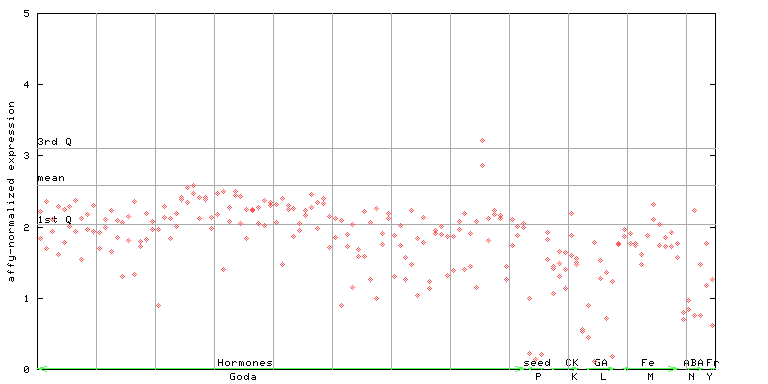
X axis is samples (xls file), and Y axis is log-expression. |
|||||||||||||||||||||||||||||||


| Link to other DBs | ||
| Entrez Gene ID | 841550 |
|
| Refseq ID (protein) | NP_001077695.4 | |
| NP_001154418.1 | |
|
| NP_001319192.1 | |
|
| NP_001319193.1 | |
|
| NP_001321256.1 | |
|
| NP_001321257.1 | |
|
| NP_001321258.1 | |
|
| NP_001321259.1 | |
|
| NP_001321260.1 | |
|
| NP_001321261.1 | |
|
| NP_001321262.1 | |
|
| NP_001321263.1 | |
|
| NP_001321264.1 | |
|
| NP_001321265.1 | |
|
| NP_175538.3 | |
|
The preparation time of this page was 0.3 [sec].