[←][→] ath
| functional annotation | |||||||||||||||||||||||||||||||||||||||
| Function | Calcium-dependent lipid-binding (CaLB domain) family protein |


|
|||||||||||||||||||||||||||||||||||||
| GO BP |
|
||||||||||||||||||||||||||||||||||||||
| GO CC |
|
||||||||||||||||||||||||||||||||||||||
| GO MF |
|
||||||||||||||||||||||||||||||||||||||
| KEGG | |||||||||||||||||||||||||||||||||||||||
| Protein | NP_564637.1 | ||||||||||||||||||||||||||||||||||||||
| BLAST | NP_564637.1 | ||||||||||||||||||||||||||||||||||||||
| Orthologous | [Ortholog page] NTMC2T6.2 (ath) LOC4329137 (osa) LOC7459123 (ppo) LOC25487119 (mtr) LOC100779958 (gma) LOC100798393 (gma) LOC101268258 (sly) LOC103841913 (bra) LOC103868426 (bra) LOC103870012 (bra) LOC123044002 (tae) LOC123051882 (tae) LOC123187759 (tae) LOC123425050 (hvu) | ||||||||||||||||||||||||||||||||||||||
| Subcellular localization wolf |
|
||||||||||||||||||||||||||||||||||||||
| Subcellular localization TargetP |
|
||||||||||||||||||||||||||||||||||||||
| Gene coexpression | |||||||||||||||||||||||||||||||||||||||
| Network*for coexpressed genes |
|
||||||||||||||||||||||||||||||||||||||
|---|---|---|---|---|---|---|---|---|---|---|---|---|---|---|---|---|---|---|---|---|---|---|---|---|---|---|---|---|---|---|---|---|---|---|---|---|---|---|---|
| Coexpressed gene list |
[Coexpressed gene list for NTMC2T6.1] | ||||||||||||||||||||||||||||||||||||||
| Gene expression | |||||||||||||||||||||||||||||||||||||||
| All samples | [Expression pattern for all samples] | ||||||||||||||||||||||||||||||||||||||
| AtGenExpress* (Development) |
260987_at
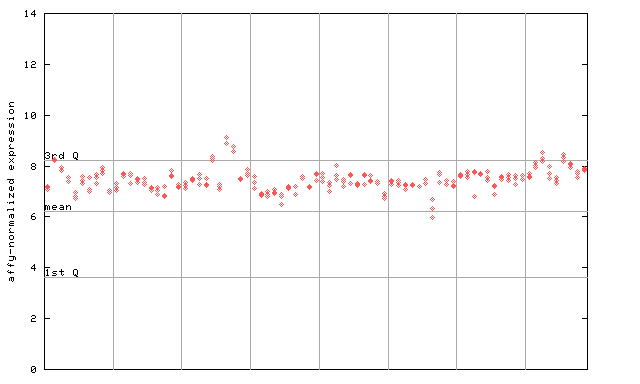
X axis is samples (pdf file), and Y axis is log2-expression. |
||||||||||||||||||||||||||||||||||||||
| AtGenExpress* (Stress) |
260987_at
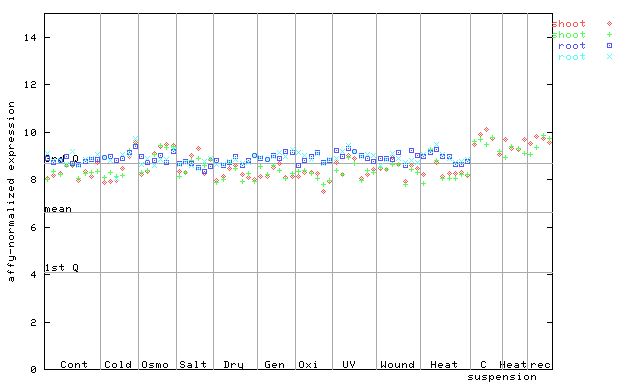
X axis is samples (pdf file), and Y axis is log2-expression. |
||||||||||||||||||||||||||||||||||||||
| AtGenExpress* (Hormone) |
260987_at
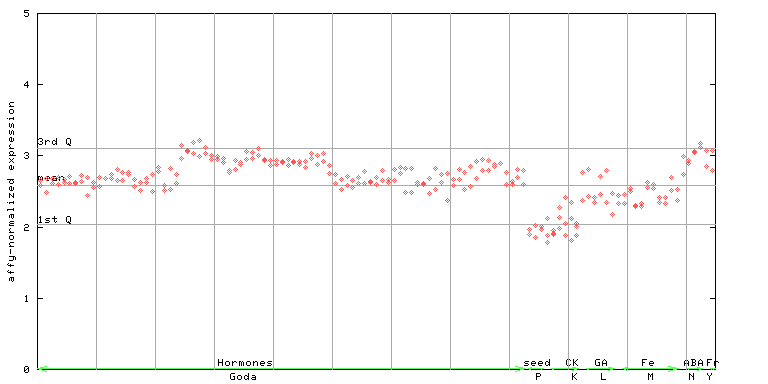
X axis is samples (xls file), and Y axis is log-expression. |
||||||||||||||||||||||||||||||||||||||


")
| Link to other DBs | ||
| Entrez Gene ID | 841794 |
|
| Refseq ID (protein) | NP_564637.1 | |
The preparation time of this page was 0.1 [sec].