[←][→] ath
| functional annotation | ||||||||||||||||||||||||||||||||||||||
| Function | RELA/SPOT homolog 3 |


|
||||||||||||||||||||||||||||||||||||
| GO BP |
|
|||||||||||||||||||||||||||||||||||||
| GO CC |
|
|||||||||||||||||||||||||||||||||||||
| GO MF |
|
|||||||||||||||||||||||||||||||||||||
| KEGG | ath00230 [list] [network] Purine metabolism (100 genes) |  |
||||||||||||||||||||||||||||||||||||
| Protein | NP_564652.2 | |||||||||||||||||||||||||||||||||||||
| BLAST | NP_564652.2 | |||||||||||||||||||||||||||||||||||||
| Orthologous | [Ortholog page] RSH2 (ath) LOC4345756 (osa) LOC4347182 (osa) LOC7490942 (ppo) LOC11421249 (mtr) LOC100253158 (vvi) LOC100787301 (gma) LOC100789399 (gma) LOC101251456 (sly) LOC103632825 (zma) LOC103643236 (zma) LOC103870072 (bra) LOC103871068 (bra) LOC109944053 (zma) | |||||||||||||||||||||||||||||||||||||
| Subcellular localization wolf |
|
|||||||||||||||||||||||||||||||||||||
| Subcellular localization TargetP |
|
|||||||||||||||||||||||||||||||||||||
| Gene coexpression | ||||||||||||||||||||||||||||||||||||||
| Network*for coexpressed genes |
|
|||||||||||||||||||||||||||||||||||||
|---|---|---|---|---|---|---|---|---|---|---|---|---|---|---|---|---|---|---|---|---|---|---|---|---|---|---|---|---|---|---|---|---|---|---|---|---|---|---|
| Coexpressed gene list |
[Coexpressed gene list for RSH3] | |||||||||||||||||||||||||||||||||||||
| Gene expression | ||||||||||||||||||||||||||||||||||||||
| All samples | [Expression pattern for all samples] | |||||||||||||||||||||||||||||||||||||
| AtGenExpress* (Development) |
263159_at
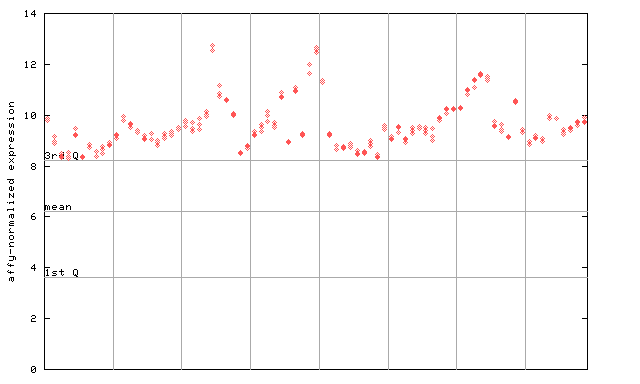
X axis is samples (pdf file), and Y axis is log2-expression. |
|||||||||||||||||||||||||||||||||||||
| AtGenExpress* (Stress) |
263159_at
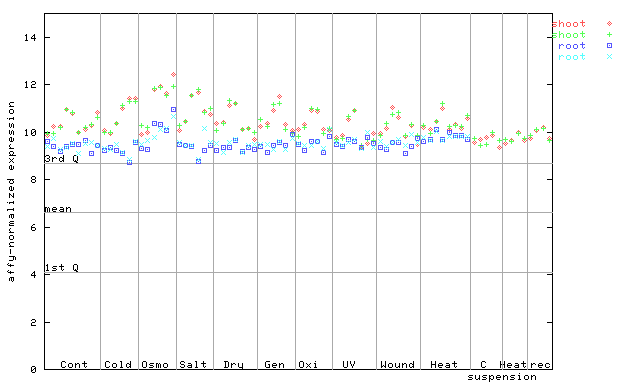
X axis is samples (pdf file), and Y axis is log2-expression. |
|||||||||||||||||||||||||||||||||||||
| AtGenExpress* (Hormone) |
263159_at
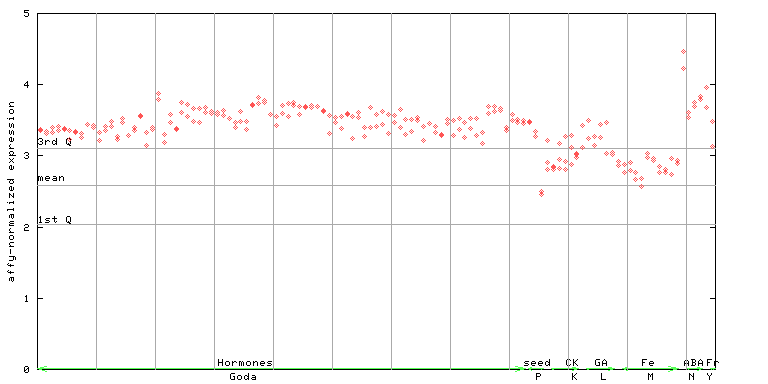
X axis is samples (xls file), and Y axis is log-expression. |
|||||||||||||||||||||||||||||||||||||


")
")
| Link to other DBs | ||
| Entrez Gene ID | 841853 |
|
| Refseq ID (protein) | NP_564652.2 | |
The preparation time of this page was 0.2 [sec].