[←][→] ath
| functional annotation | ||||||||||||||||||||||||||||||||||||||
| Function | photosystem I subunit G |


|
||||||||||||||||||||||||||||||||||||
| GO BP |
|
|||||||||||||||||||||||||||||||||||||
| GO CC |
|
|||||||||||||||||||||||||||||||||||||
| GO MF |
|
|||||||||||||||||||||||||||||||||||||
| KEGG | ath00195 [list] [network] Photosynthesis (77 genes) |  |
||||||||||||||||||||||||||||||||||||
| Protein | NP_175963.1 | |||||||||||||||||||||||||||||||||||||
| BLAST | NP_175963.1 | |||||||||||||||||||||||||||||||||||||
| Orthologous | [Ortholog page] LOC4347395 (osa) LOC7457672 (ppo) LOC11422409 (mtr) LOC18103568 (ppo) LOC100305786 (gma) LOC100499718 (gma) LOC101263732 (sly) LOC103832566 (bra) LOC103868386 (bra) LOC103871027 (bra) LOC123104110 (tae) LOC123112335 (tae) LOC123121866 (tae) LOC123399223 (hvu) | |||||||||||||||||||||||||||||||||||||
| Subcellular localization wolf |
|
|||||||||||||||||||||||||||||||||||||
| Subcellular localization TargetP |
|
|||||||||||||||||||||||||||||||||||||
| Gene coexpression | ||||||||||||||||||||||||||||||||||||||
| Network*for coexpressed genes |
|
|||||||||||||||||||||||||||||||||||||
|---|---|---|---|---|---|---|---|---|---|---|---|---|---|---|---|---|---|---|---|---|---|---|---|---|---|---|---|---|---|---|---|---|---|---|---|---|---|---|
| Coexpressed gene list |
[Coexpressed gene list for PSAG] | |||||||||||||||||||||||||||||||||||||
| Gene expression | ||||||||||||||||||||||||||||||||||||||
| All samples | [Expression pattern for all samples] | |||||||||||||||||||||||||||||||||||||
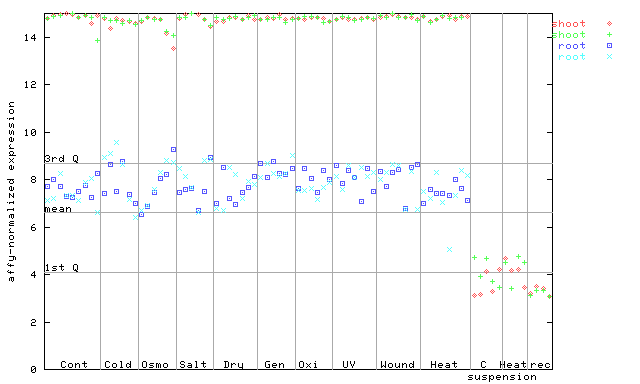
| AtGenExpress* (Development) |
264545_at
X axis is samples (pdf file), and Y axis is log2-expression. |
|||||||||||||||||||||||||||||||||||||
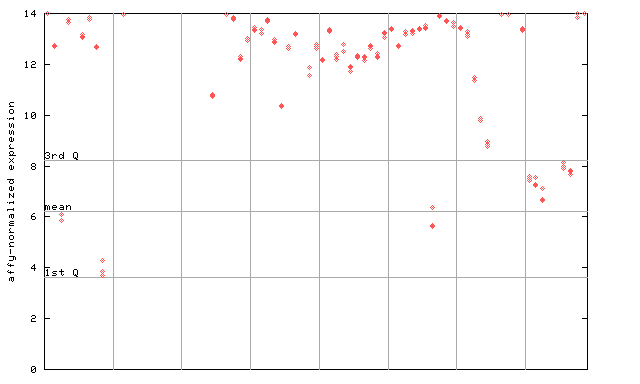
| AtGenExpress* (Stress) |
264545_at
X axis is samples (pdf file), and Y axis is log2-expression. |
|||||||||||||||||||||||||||||||||||||
| AtGenExpress* (Hormone) |
264545_at
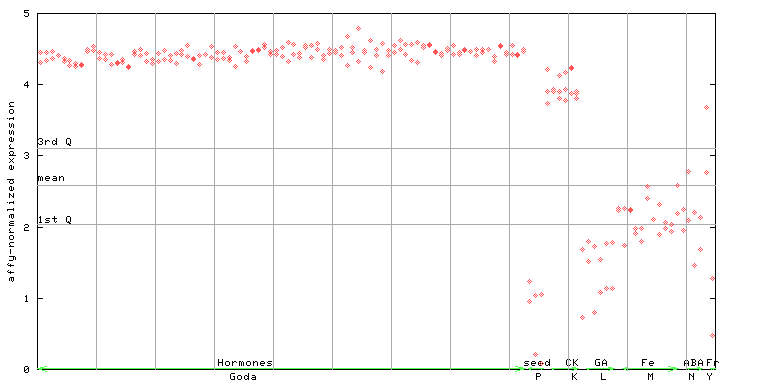
X axis is samples (xls file), and Y axis is log-expression. |
|||||||||||||||||||||||||||||||||||||


")
")
| Link to other DBs | ||
| Entrez Gene ID | 842016 |
|
| Refseq ID (protein) | NP_175963.1 | |
The preparation time of this page was 0.1 [sec].