[←][→] ath
| functional annotation | |||||||||||||||||||||||||||||||||||||||
| Function | Tetratricopeptide repeat (TPR)-like superfamily protein |


|
|||||||||||||||||||||||||||||||||||||
| GO BP |
|
||||||||||||||||||||||||||||||||||||||
| GO CC |
|
||||||||||||||||||||||||||||||||||||||
| GO MF |
|
||||||||||||||||||||||||||||||||||||||
| KEGG | |||||||||||||||||||||||||||||||||||||||
| Protein | NP_176276.1 | ||||||||||||||||||||||||||||||||||||||
| BLAST | NP_176276.1 | ||||||||||||||||||||||||||||||||||||||
| Orthologous | [Ortholog page] LOC4335473 (osa) LOC7462981 (ppo) LOC18100411 (ppo) LOC25501457 (mtr) LOC100801616 (gma) LOC101257127 (sly) LOC103830017 (bra) LOC103838488 (bra) LOC112327811 (ppo) LOC123088237 (tae) LOC123146915 (tae) LOC123164151 (tae) LOC123412328 (hvu) | ||||||||||||||||||||||||||||||||||||||
| Subcellular localization wolf |
|
||||||||||||||||||||||||||||||||||||||
| Subcellular localization TargetP |
|
||||||||||||||||||||||||||||||||||||||
| Gene coexpression | |||||||||||||||||||||||||||||||||||||||
| Network*for coexpressed genes |
|
||||||||||||||||||||||||||||||||||||||
|---|---|---|---|---|---|---|---|---|---|---|---|---|---|---|---|---|---|---|---|---|---|---|---|---|---|---|---|---|---|---|---|---|---|---|---|---|---|---|---|
| Coexpressed gene list |
[Coexpressed gene list for AT1G60770] | ||||||||||||||||||||||||||||||||||||||
| Gene expression | |||||||||||||||||||||||||||||||||||||||
| All samples | [Expression pattern for all samples] | ||||||||||||||||||||||||||||||||||||||
| AtGenExpress* (Development) |
264913_at
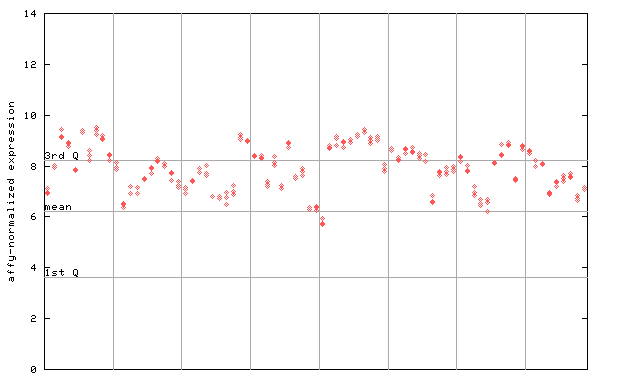
X axis is samples (pdf file), and Y axis is log2-expression. |
||||||||||||||||||||||||||||||||||||||
| AtGenExpress* (Stress) |
264913_at
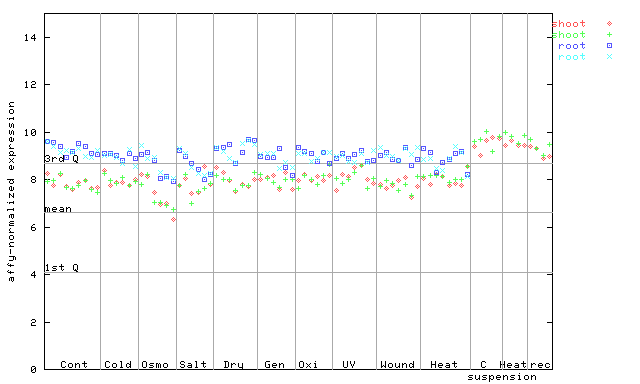
X axis is samples (pdf file), and Y axis is log2-expression. |
||||||||||||||||||||||||||||||||||||||
| AtGenExpress* (Hormone) |
264913_at
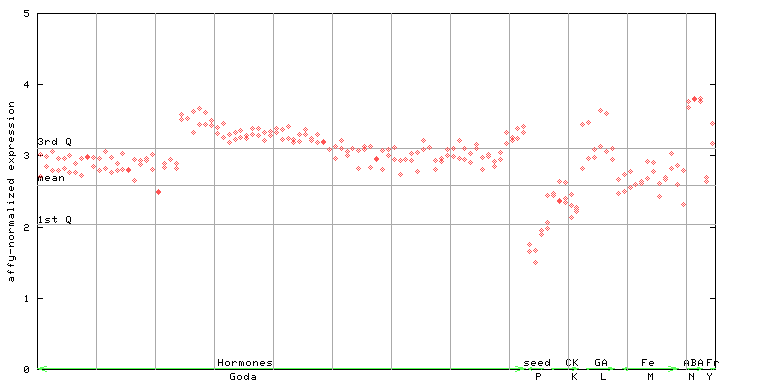
X axis is samples (xls file), and Y axis is log-expression. |
||||||||||||||||||||||||||||||||||||||


")
| Link to other DBs | ||
| Entrez Gene ID | 842371 |
|
| Refseq ID (protein) | NP_176276.1 | |
The preparation time of this page was 0.1 [sec].