[←][→] ath
| functional annotation | ||||||||||
| Function | maternal effect embryo arrest 9 |


|
||||||||
| GO BP |
|
|||||||||
| GO CC |
|
|||||||||
| GO MF |
|
|||||||||
| KEGG | ||||||||||
| Protein | NP_564765.1 | |||||||||
| BLAST | NP_564765.1 | |||||||||
| Orthologous | [Ortholog page] LOC4340451 (osa) LOC7458467 (ppo) LOC11418822 (mtr) LOC18106016 (ppo) LOC100306561 (gma) LOC101255737 (sly) LOC103848325 (bra) LOC123149374 (tae) LOC123157391 (tae) LOC123166626 (tae) LOC123411291 (hvu) | |||||||||
| Subcellular localization wolf |
|
|||||||||
| Subcellular localization TargetP |
|
|||||||||
| Gene coexpression | ||||||||||
| Network*for coexpressed genes |
||||||||||
|---|---|---|---|---|---|---|---|---|---|---|
| Coexpressed gene list |
[Coexpressed gene list for MEE9] | |||||||||
| Gene expression | ||||||||||
| All samples | [Expression pattern for all samples] | |||||||||
| AtGenExpress* (Development) |
259909_at
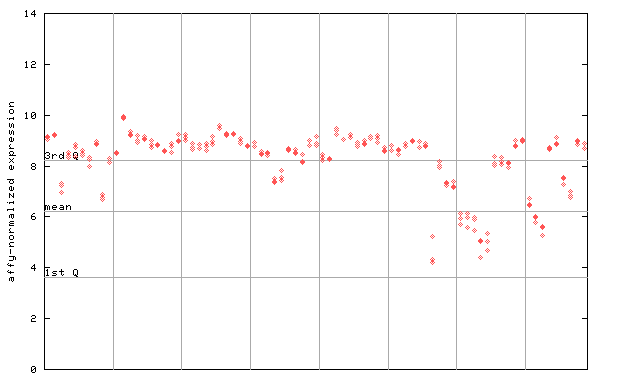
X axis is samples (pdf file), and Y axis is log2-expression. |
|||||||||
| AtGenExpress* (Stress) |
259909_at
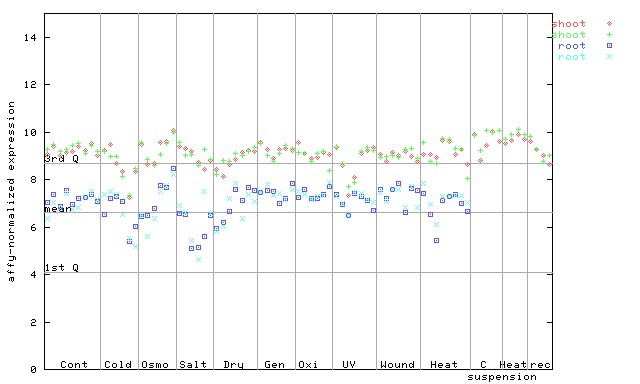
X axis is samples (pdf file), and Y axis is log2-expression. |
|||||||||
| AtGenExpress* (Hormone) |
259909_at
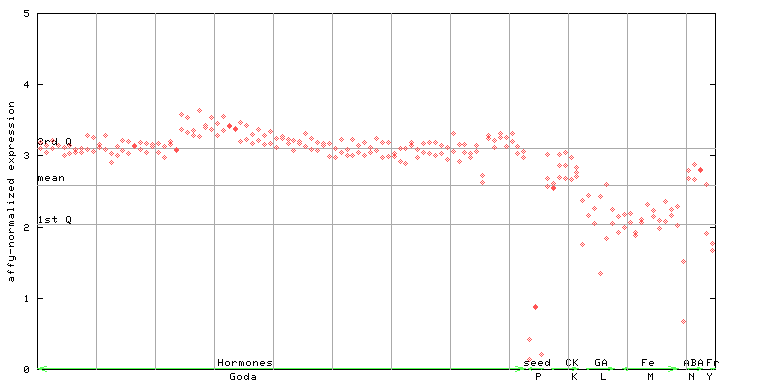
X axis is samples (xls file), and Y axis is log-expression. |
|||||||||


| Link to other DBs | ||
| Entrez Gene ID | 842379 |
|
| Refseq ID (protein) | NP_564765.1 | |
The preparation time of this page was 0.1 [sec].