[←][→] ath
| functional annotation | |||||||||||||||||||||||||||||||||||||||
| Function | microsomal glutathione s-transferase |


|
|||||||||||||||||||||||||||||||||||||
| GO BP |
|
||||||||||||||||||||||||||||||||||||||
| GO CC |
|
||||||||||||||||||||||||||||||||||||||
| GO MF |
|
||||||||||||||||||||||||||||||||||||||
| KEGG | ath00480 [list] [network] Glutathione metabolism (102 genes) |  |
|||||||||||||||||||||||||||||||||||||
| Protein | NP_001154451.1 NP_001154452.1 NP_176758.1 | ||||||||||||||||||||||||||||||||||||||
| BLAST | NP_001154451.1 NP_001154452.1 NP_176758.1 | ||||||||||||||||||||||||||||||||||||||
| Orthologous | [Ortholog page] LOC4333870 (osa) LOC7493601 (ppo) LOC11425943 (mtr) LOC100216831 (zma) LOC100265100 (vvi) LOC101263072 (sly) LOC103849094 (bra) LOC103852296 (bra) LOC103863708 (bra) | ||||||||||||||||||||||||||||||||||||||
| Subcellular localization wolf |
|
||||||||||||||||||||||||||||||||||||||
| Subcellular localization TargetP |
|
||||||||||||||||||||||||||||||||||||||
| Gene coexpression | |||||||||||||||||||||||||||||||||||||||
| Network*for coexpressed genes |
|
||||||||||||||||||||||||||||||||||||||
|---|---|---|---|---|---|---|---|---|---|---|---|---|---|---|---|---|---|---|---|---|---|---|---|---|---|---|---|---|---|---|---|---|---|---|---|---|---|---|---|
| Coexpressed gene list |
[Coexpressed gene list for AT1G65820] | ||||||||||||||||||||||||||||||||||||||
| Gene expression | |||||||||||||||||||||||||||||||||||||||
| All samples | [Expression pattern for all samples] | ||||||||||||||||||||||||||||||||||||||
| AtGenExpress* (Development) |
262932_at
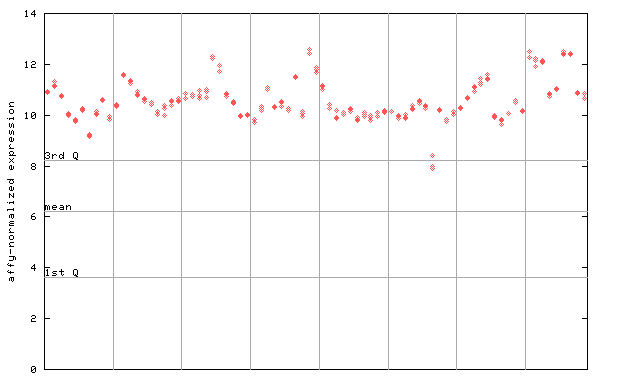
X axis is samples (pdf file), and Y axis is log2-expression. |
||||||||||||||||||||||||||||||||||||||
| AtGenExpress* (Stress) |
262932_at
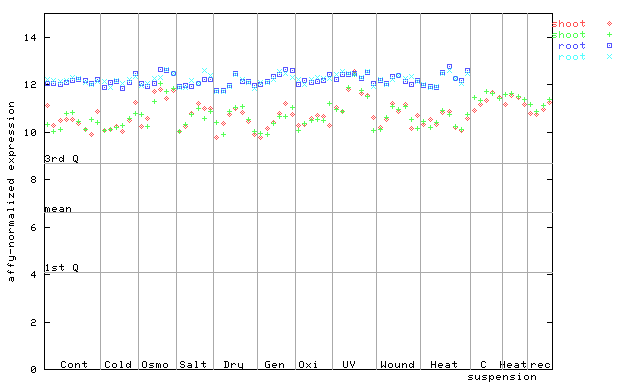
X axis is samples (pdf file), and Y axis is log2-expression. |
||||||||||||||||||||||||||||||||||||||
| AtGenExpress* (Hormone) |
262932_at
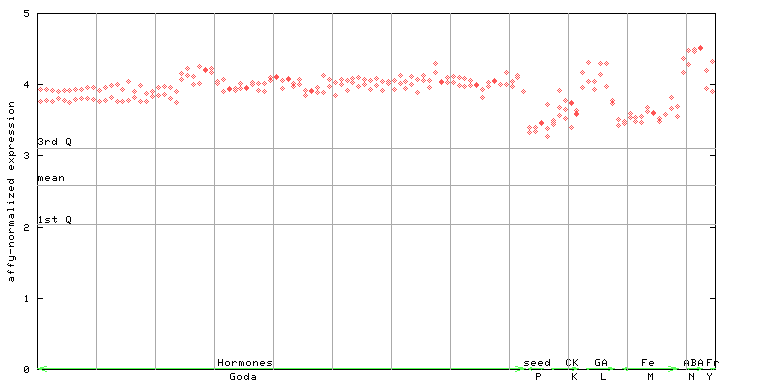
X axis is samples (xls file), and Y axis is log-expression. |
||||||||||||||||||||||||||||||||||||||


")
| Link to other DBs | ||
| Entrez Gene ID | 842893 |
|
| Refseq ID (protein) | NP_001154451.1 | |
| NP_001154452.1 | |
|
| NP_176758.1 | |
|
The preparation time of this page was 0.2 [sec].