[←][→] ath
| functional annotation | |||||||||||||||||||||||||||||||||||||||
| Function | DnaA initiator-associating protein |

 Plant GARDEN Plant GARDEN JBrowse
|
|||||||||||||||||||||||||||||||||||||
| GO BP |
|
||||||||||||||||||||||||||||||||||||||
| GO CC |
|
||||||||||||||||||||||||||||||||||||||
| GO MF |
|
||||||||||||||||||||||||||||||||||||||
| KEGG | |||||||||||||||||||||||||||||||||||||||
| Protein | NP_001321671.1 NP_176875.1 | ||||||||||||||||||||||||||||||||||||||
| BLAST | NP_001321671.1 NP_176875.1 | ||||||||||||||||||||||||||||||||||||||
| Orthologous | [Ortholog page] LOC7456832 (ppo) LOC11438404 (mtr) LOC18099480 (ppo) LOC25491286 (mtr) LOC25495639 (mtr) LOC100809045 (gma) LOC100813026 (gma) TRM22 (sly) LOC103831147 (bra) LOC103852360 (bra) | ||||||||||||||||||||||||||||||||||||||
| Subcellular localization wolf |
|
||||||||||||||||||||||||||||||||||||||
| Subcellular localization TargetP |
|
||||||||||||||||||||||||||||||||||||||
| Gene coexpression | |||||||||||||||||||||||||||||||||||||||
| Network*for coexpressed genes |
|
||||||||||||||||||||||||||||||||||||||
|---|---|---|---|---|---|---|---|---|---|---|---|---|---|---|---|---|---|---|---|---|---|---|---|---|---|---|---|---|---|---|---|---|---|---|---|---|---|---|---|
| Coexpressed gene list |
[Coexpressed gene list for TRM22] | ||||||||||||||||||||||||||||||||||||||
| Gene expression | |||||||||||||||||||||||||||||||||||||||
| All samples | [Expression pattern for all samples] | ||||||||||||||||||||||||||||||||||||||
| AtGenExpress* (Development) |
255851_at
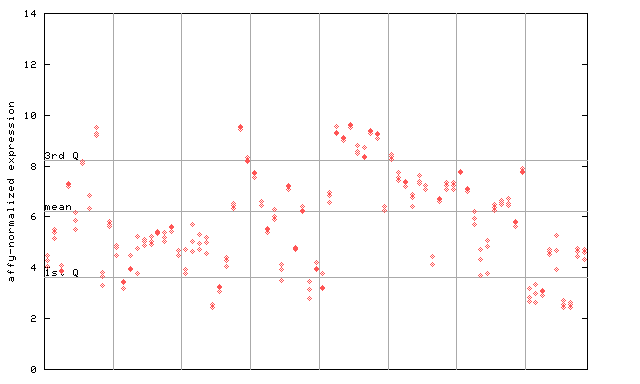
X axis is samples (pdf file), and Y axis is log2-expression. |
||||||||||||||||||||||||||||||||||||||
| AtGenExpress* (Stress) |
255851_at
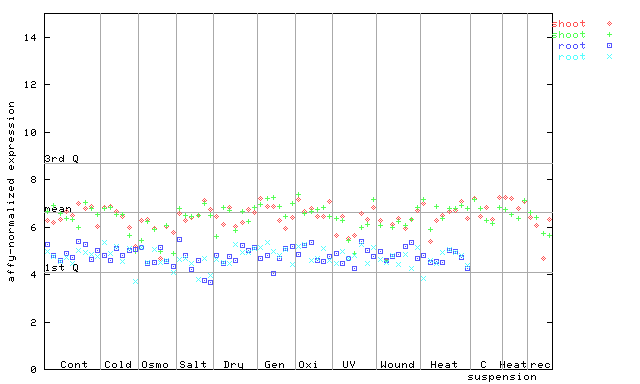
X axis is samples (pdf file), and Y axis is log2-expression. |
||||||||||||||||||||||||||||||||||||||
| AtGenExpress* (Hormone) |
255851_at
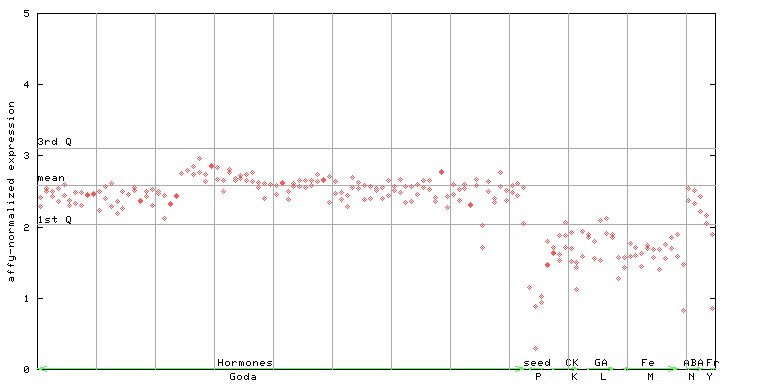
X axis is samples (xls file), and Y axis is log-expression. |
||||||||||||||||||||||||||||||||||||||


")
| Link to other DBs | ||
| Entrez Gene ID | 843024 |
|
| Refseq ID (protein) | NP_001321671.1 | |
| NP_176875.1 | |
|
The preparation time of this page was 0.5 [sec].