[←][→] ath
| functional annotation | |||||||||||||||||||||||||||||||||||||||||
| Function | homologue of bacterial MinE 1 |


|
|||||||||||||||||||||||||||||||||||||||
| GO BP |
|
||||||||||||||||||||||||||||||||||||||||
| GO CC |
|
||||||||||||||||||||||||||||||||||||||||
| GO MF |
|
||||||||||||||||||||||||||||||||||||||||
| KEGG | |||||||||||||||||||||||||||||||||||||||||
| Protein | NP_564964.1 | ||||||||||||||||||||||||||||||||||||||||
| BLAST | NP_564964.1 | ||||||||||||||||||||||||||||||||||||||||
| Orthologous | [Ortholog page] LOC541645 (zma) LOC732562 (gma) LOC4352263 (osa) LOC7463033 (ppo) LOC7481551 (ppo) LOC11429369 (mtr) LOC100257816 (vvi) LOC100265788 (vvi) LOC100499811 (gma) LOC101253186 (sly) LOC103831336 (bra) LOC103852576 (bra) | ||||||||||||||||||||||||||||||||||||||||
| Subcellular localization wolf |
|
||||||||||||||||||||||||||||||||||||||||
| Subcellular localization TargetP |
|
||||||||||||||||||||||||||||||||||||||||
| Gene coexpression | |||||||||||||||||||||||||||||||||||||||||
| Network*for coexpressed genes |
|
||||||||||||||||||||||||||||||||||||||||
|---|---|---|---|---|---|---|---|---|---|---|---|---|---|---|---|---|---|---|---|---|---|---|---|---|---|---|---|---|---|---|---|---|---|---|---|---|---|---|---|---|---|
| Coexpressed gene list |
[Coexpressed gene list for MINE1] | ||||||||||||||||||||||||||||||||||||||||
| Gene expression | |||||||||||||||||||||||||||||||||||||||||
| All samples | [Expression pattern for all samples] | ||||||||||||||||||||||||||||||||||||||||
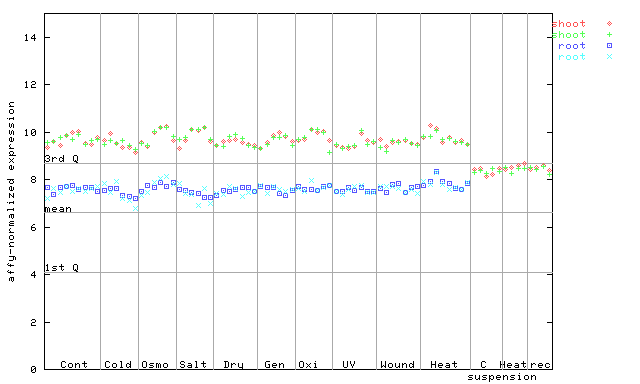
| AtGenExpress* (Development) |
260356_at
X axis is samples (pdf file), and Y axis is log2-expression. |
||||||||||||||||||||||||||||||||||||||||
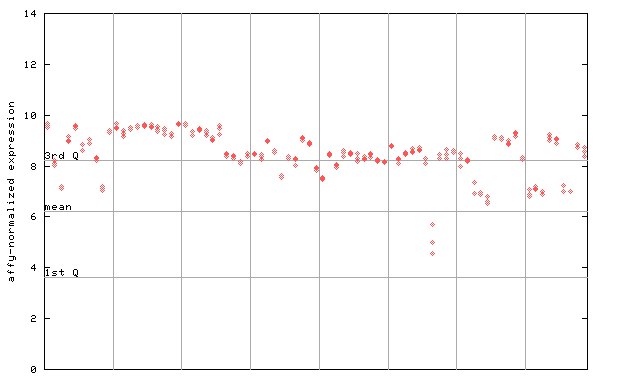
| AtGenExpress* (Stress) |
260356_at
X axis is samples (pdf file), and Y axis is log2-expression. |
||||||||||||||||||||||||||||||||||||||||
| AtGenExpress* (Hormone) |
260356_at
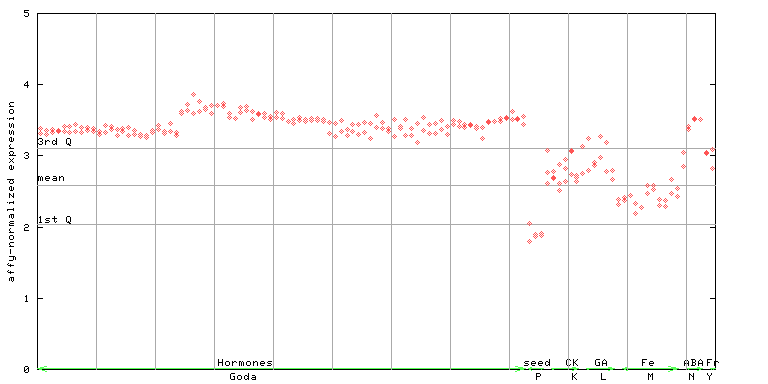
X axis is samples (xls file), and Y axis is log-expression. |
||||||||||||||||||||||||||||||||||||||||


| Link to other DBs | ||
| Entrez Gene ID | 843271 |
|
| Refseq ID (protein) | NP_564964.1 | |
The preparation time of this page was 0.2 [sec].