[←][→] ath
| functional annotation | ||||||||||||||||||||||||||||||||||
| Function | cellulase 3 |


|
||||||||||||||||||||||||||||||||
| GO BP |
|
|||||||||||||||||||||||||||||||||
| GO CC |
|
|||||||||||||||||||||||||||||||||
| GO MF |
|
|||||||||||||||||||||||||||||||||
| KEGG | ath00500 [list] [network] Starch and sucrose metabolism (165 genes) |  |
||||||||||||||||||||||||||||||||
| Protein | NP_177294.1 | |||||||||||||||||||||||||||||||||
| BLAST | NP_177294.1 | |||||||||||||||||||||||||||||||||
| Orthologous | [Ortholog page] cel7 (sly) CEL5 (ath) LOC4335944 (osa) LOC11420339 (mtr) LOC100248251 (vvi) LOC100788283 (gma) LOC100791156 (gma) LOC103641675 (zma) LOC103829306 (bra) LOC103831659 (bra) LOC103852723 (bra) LOC103852724 (bra) | |||||||||||||||||||||||||||||||||
| Subcellular localization wolf |
|
|||||||||||||||||||||||||||||||||
| Subcellular localization TargetP |
|
|||||||||||||||||||||||||||||||||
| Gene coexpression | ||||||||||||||||||||||||||||||||||
| Network*for coexpressed genes |
|
|||||||||||||||||||||||||||||||||
|---|---|---|---|---|---|---|---|---|---|---|---|---|---|---|---|---|---|---|---|---|---|---|---|---|---|---|---|---|---|---|---|---|---|---|
| Coexpressed gene list |
[Coexpressed gene list for CEL3] | |||||||||||||||||||||||||||||||||
| Gene expression | ||||||||||||||||||||||||||||||||||
| All samples | [Expression pattern for all samples] | |||||||||||||||||||||||||||||||||
| AtGenExpress* (Development) |
259897_at
X axis is samples (pdf file), and Y axis is log2-expression. |
|||||||||||||||||||||||||||||||||
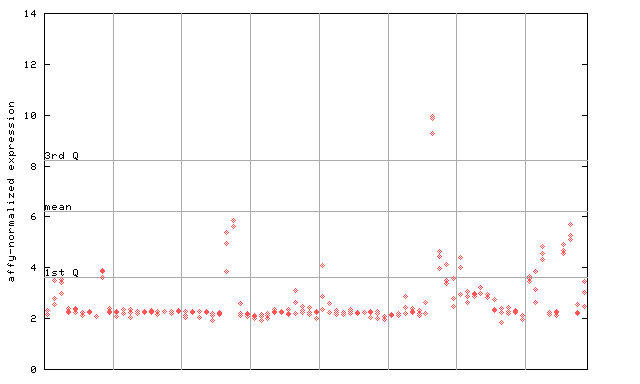
| AtGenExpress* (Stress) |
259897_at
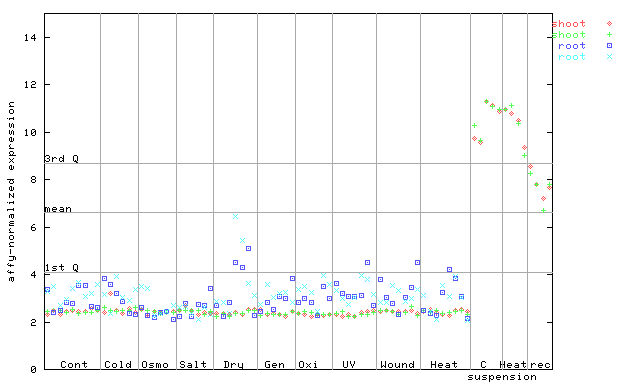
X axis is samples (pdf file), and Y axis is log2-expression. |
|||||||||||||||||||||||||||||||||
| AtGenExpress* (Hormone) |
259897_at
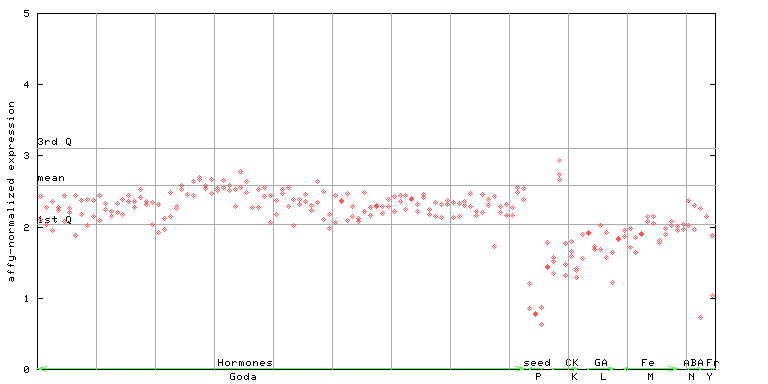
X axis is samples (xls file), and Y axis is log-expression. |
|||||||||||||||||||||||||||||||||


")
| Link to other DBs | ||
| Entrez Gene ID | 843479 |
|
| Refseq ID (protein) | NP_177294.1 | |
The preparation time of this page was 0.2 [sec].