[←][→] ath
| functional annotation | ||||||||||||||||||||||||||
| Function | GDSL-like Lipase/Acylhydrolase superfamily protein |


|
||||||||||||||||||||||||
| GO BP |
|
|||||||||||||||||||||||||
| GO CC |
|
|||||||||||||||||||||||||
| GO MF |
|
|||||||||||||||||||||||||
| KEGG | ||||||||||||||||||||||||||
| Protein | NP_001322417.1 NP_565021.2 NP_974125.1 | |||||||||||||||||||||||||
| BLAST | NP_001322417.1 NP_565021.2 NP_974125.1 | |||||||||||||||||||||||||
| Orthologous | [Ortholog page] LOC4338820 (osa) LOC4344495 (osa) LOC7475772 (ppo) LOC11405352 (mtr) LOC100258563 (vvi) LOC100281363 (zma) LOC100779380 (gma) LOC101249518 (sly) LOC101250517 (sly) LOC102669928 (gma) LOC103628962 (zma) LOC103830842 (bra) LOC103831674 (bra) LOC107522106 (zma) | |||||||||||||||||||||||||
| Subcellular localization wolf |
|
|||||||||||||||||||||||||
| Subcellular localization TargetP |
|
|||||||||||||||||||||||||
| Gene coexpression | ||||||||||||||||||||||||||
| Network*for coexpressed genes |
|
|||||||||||||||||||||||||
|---|---|---|---|---|---|---|---|---|---|---|---|---|---|---|---|---|---|---|---|---|---|---|---|---|---|---|
| Coexpressed gene list |
[Coexpressed gene list for AT1G71691] | |||||||||||||||||||||||||
| Gene expression | ||||||||||||||||||||||||||
| All samples | [Expression pattern for all samples] | |||||||||||||||||||||||||
| AtGenExpress* (Development) |
261503_at
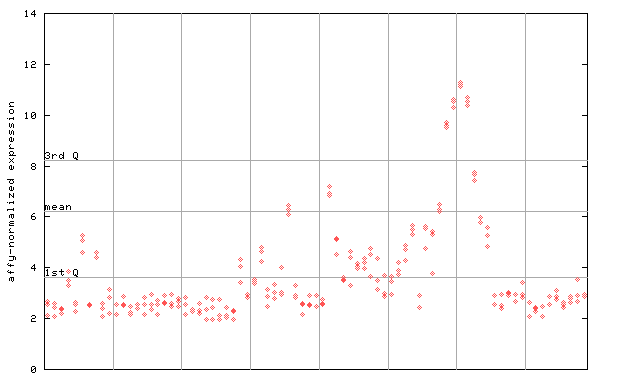
X axis is samples (pdf file), and Y axis is log2-expression. |
|||||||||||||||||||||||||
| AtGenExpress* (Stress) |
261503_at
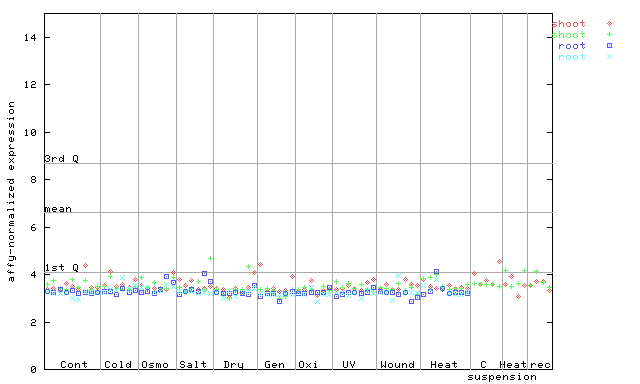
X axis is samples (pdf file), and Y axis is log2-expression. |
|||||||||||||||||||||||||
| AtGenExpress* (Hormone) |
261503_at
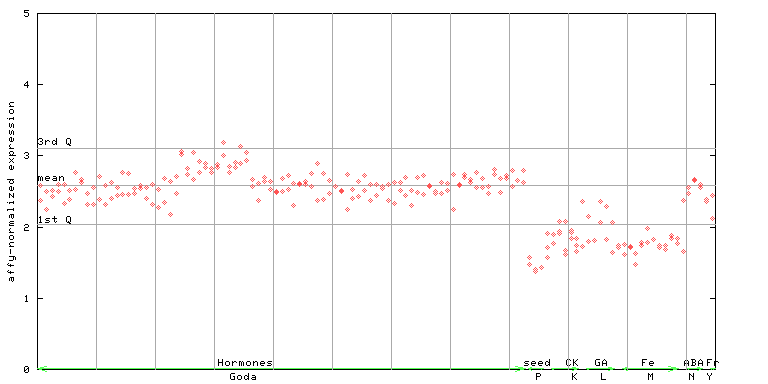
X axis is samples (xls file), and Y axis is log-expression. |
|||||||||||||||||||||||||


| Link to other DBs | ||
| Entrez Gene ID | 843496 |
|
| Refseq ID (protein) | NP_001322417.1 | |
| NP_565021.2 | |
|
| NP_974125.1 | |
|
The preparation time of this page was 0.2 [sec].