[←][→] ath
| functional annotation | ||||||||||||||||||||||||||||||||||||||||||||||||
| Function | P-loop containing nucleoside triphosphate hydrolases superfamily protein |


|
||||||||||||||||||||||||||||||||||||||||||||||
| GO BP |
|
|||||||||||||||||||||||||||||||||||||||||||||||
| GO CC |
|
|||||||||||||||||||||||||||||||||||||||||||||||
| GO MF |
|
|||||||||||||||||||||||||||||||||||||||||||||||
| KEGG | ||||||||||||||||||||||||||||||||||||||||||||||||
| Protein | NP_001077817.1 NP_001323292.1 NP_001323293.1 NP_177460.2 | |||||||||||||||||||||||||||||||||||||||||||||||
| BLAST | NP_001077817.1 NP_001323292.1 NP_001323293.1 NP_177460.2 | |||||||||||||||||||||||||||||||||||||||||||||||
| Orthologous | [Ortholog page] LOC4340177 (osa) LOC25502519 (mtr) LOC100243620 (vvi) LOC100274315 (zma) LOC100807394 (gma) LOC101257931 (sly) LOC103852828 (bra) | |||||||||||||||||||||||||||||||||||||||||||||||
| Subcellular localization wolf |
|
|||||||||||||||||||||||||||||||||||||||||||||||
| Subcellular localization TargetP |
|
|||||||||||||||||||||||||||||||||||||||||||||||
| Gene coexpression | ||||||||||||||||||||||||||||||||||||||||||||||||
| Network*for coexpressed genes |
|
|||||||||||||||||||||||||||||||||||||||||||||||
|---|---|---|---|---|---|---|---|---|---|---|---|---|---|---|---|---|---|---|---|---|---|---|---|---|---|---|---|---|---|---|---|---|---|---|---|---|---|---|---|---|---|---|---|---|---|---|---|---|
| Coexpressed gene list |
[Coexpressed gene list for AT1G73170] | |||||||||||||||||||||||||||||||||||||||||||||||
| Gene expression | ||||||||||||||||||||||||||||||||||||||||||||||||
| All samples | [Expression pattern for all samples] | |||||||||||||||||||||||||||||||||||||||||||||||
| AtGenExpress* (Development) |
260089_at
X axis is samples (pdf file), and Y axis is log2-expression. |
|||||||||||||||||||||||||||||||||||||||||||||||
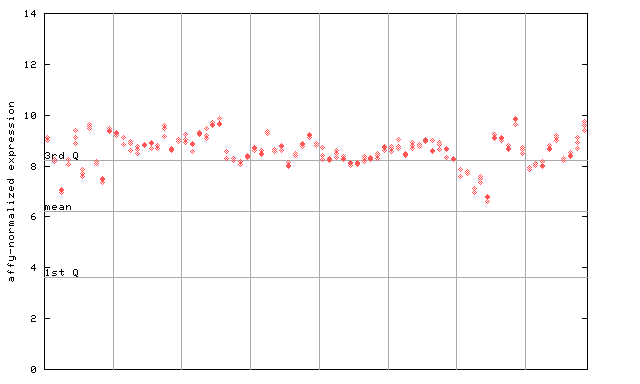
| AtGenExpress* (Stress) |
260089_at
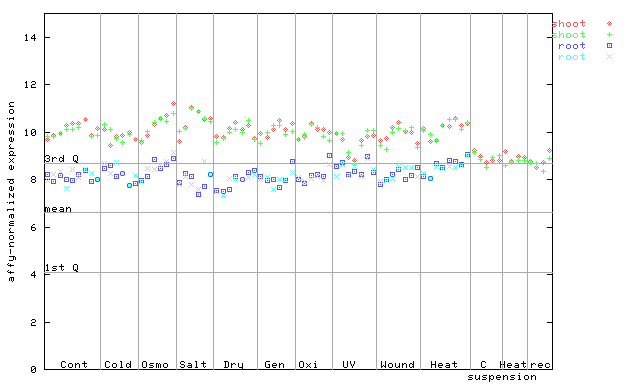
X axis is samples (pdf file), and Y axis is log2-expression. |
|||||||||||||||||||||||||||||||||||||||||||||||
| AtGenExpress* (Hormone) |
260089_at
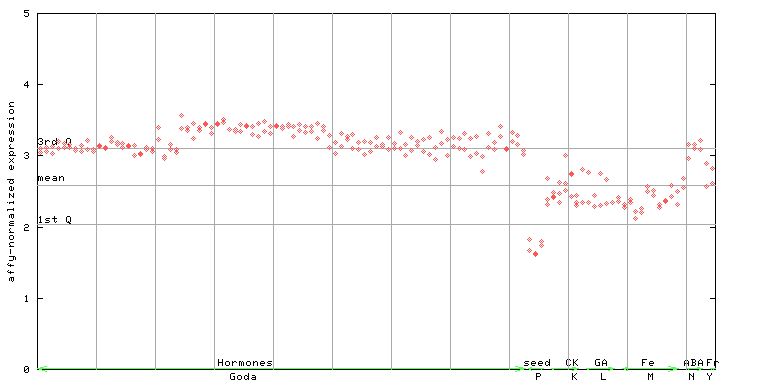
X axis is samples (xls file), and Y axis is log-expression. |
|||||||||||||||||||||||||||||||||||||||||||||||


")
")
| Link to other DBs | ||
| Entrez Gene ID | 843649 |
|
| Refseq ID (protein) | NP_001077817.1 | |
| NP_001323292.1 | |
|
| NP_001323293.1 | |
|
| NP_177460.2 | |
|
The preparation time of this page was 0.2 [sec].