[←][→] ath
| functional annotation | ||||||||||||||||||||||||||
| Function | low-molecular-weight cysteine-rich 67 |


|
||||||||||||||||||||||||
| GO BP |
|
|||||||||||||||||||||||||
| GO CC |
|
|||||||||||||||||||||||||
| GO MF |
|
|||||||||||||||||||||||||
| KEGG | ||||||||||||||||||||||||||
| Protein | NP_565119.1 | |||||||||||||||||||||||||
| BLAST | NP_565119.1 | |||||||||||||||||||||||||
| Orthologous | [Ortholog page] PDF1.3 (ath) PDF1.2b (ath) PDF1.2 (ath) PDF1.2c (ath) PDF1.4 (ath) PDF1.5 (ath) LOC25500300 (mtr) LOC101244389 (sly) LOC101267035 (sly) LOC102670378 (gma) LOC103830637 (bra) LOC103832030 (bra) LOC103832031 (bra) LOC103832032 (bra) LOC103835839 (bra) LOC103852983 (bra) LOC103852987 (bra) LOC103853416 (bra) | |||||||||||||||||||||||||
| Subcellular localization wolf |
|
|||||||||||||||||||||||||
| Subcellular localization TargetP |
|
|||||||||||||||||||||||||
| Gene coexpression | ||||||||||||||||||||||||||
| Network*for coexpressed genes |
|
|||||||||||||||||||||||||
|---|---|---|---|---|---|---|---|---|---|---|---|---|---|---|---|---|---|---|---|---|---|---|---|---|---|---|
| Coexpressed gene list |
[Coexpressed gene list for LCR67] | |||||||||||||||||||||||||
| Gene expression | ||||||||||||||||||||||||||
| All samples | [Expression pattern for all samples] | |||||||||||||||||||||||||
| AtGenExpress* (Development) |
262679_at
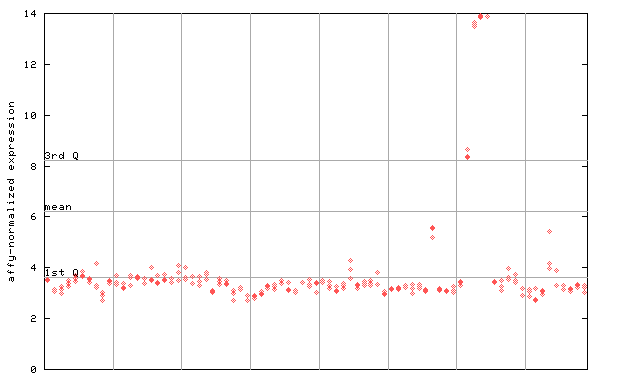
X axis is samples (pdf file), and Y axis is log2-expression. |
|||||||||||||||||||||||||
| AtGenExpress* (Stress) |
262679_at
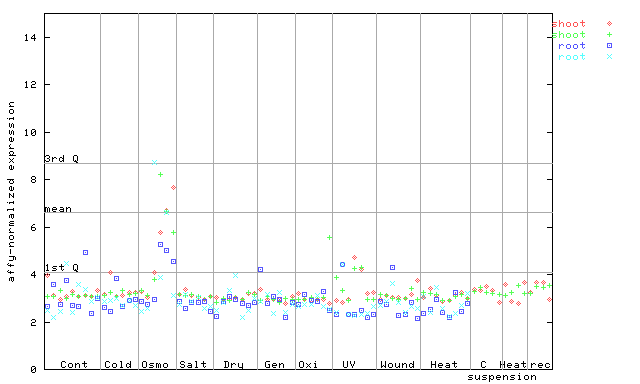
X axis is samples (pdf file), and Y axis is log2-expression. |
|||||||||||||||||||||||||
| AtGenExpress* (Hormone) |
262679_at
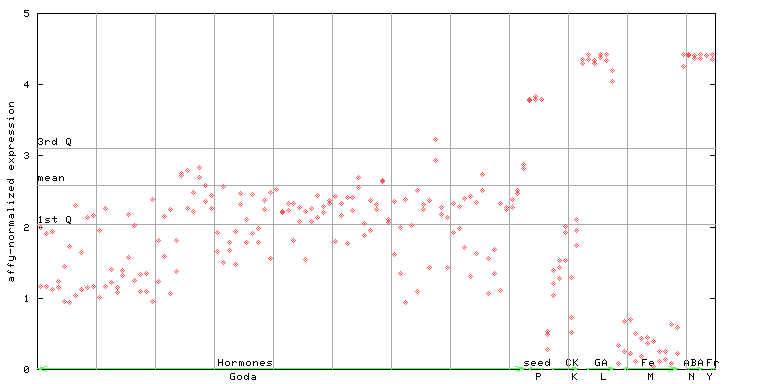
X axis is samples (xls file), and Y axis is log-expression. |
|||||||||||||||||||||||||


| Link to other DBs | ||
| Entrez Gene ID | 843916 |
|
| Refseq ID (protein) | NP_565119.1 | |
The preparation time of this page was 0.2 [sec].