[←][→] ath
| functional annotation | ||||||
| Function | O-linked-mannose beta-1,4-N-acetylglucosaminyltransferase-like protein |


|
||||
| GO BP |
|
|||||
| GO CC |
|
|||||
| GO MF |
|
|||||
| KEGG | ||||||
| Protein | NP_001325194.1 NP_178436.2 | |||||
| BLAST | NP_001325194.1 NP_178436.2 | |||||
| Orthologous | [Ortholog page] AT2G03360 (ath) LOC7492902 (ppo) LOC7498200 (ppo) LOC11411470 (mtr) LOC11414995 (mtr) LOC100241096 (vvi) LOC100800935 (gma) LOC101251980 (sly) LOC103839408 (bra) LOC103875433 (bra) | |||||
| Subcellular localization wolf |
|
|||||
| Subcellular localization TargetP |
|
|||||
| Gene coexpression | ||||||
| Network*for coexpressed genes |
||||||
|---|---|---|---|---|---|---|
| Coexpressed gene list |
[Coexpressed gene list for AT2G03370] | |||||
| Gene expression | ||||||
| All samples | [Expression pattern for all samples] | |||||
| AtGenExpress* (Development) |
265710_at
X axis is samples (pdf file), and Y axis is log2-expression. |
|||||
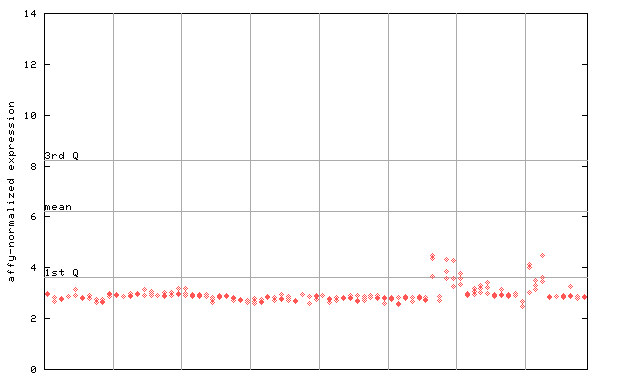
| AtGenExpress* (Stress) |
265710_at
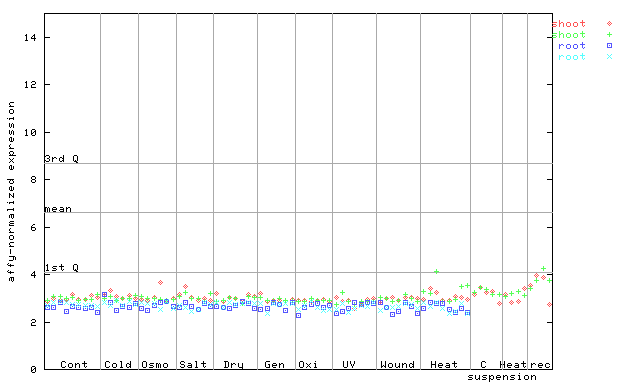
X axis is samples (pdf file), and Y axis is log2-expression. |
|||||
| AtGenExpress* (Hormone) |
265710_at
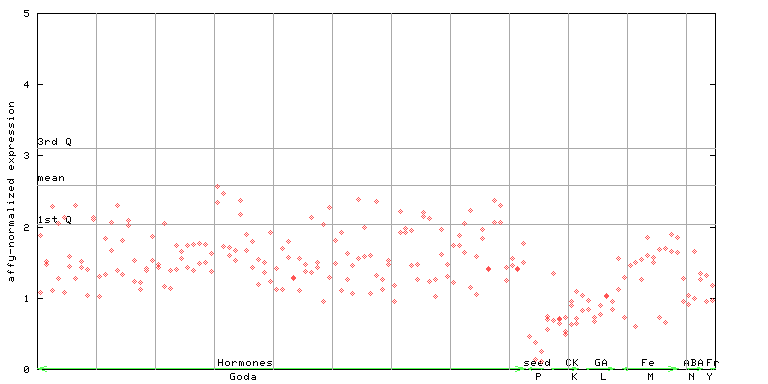
X axis is samples (xls file), and Y axis is log-expression. |
|||||

| Link to other DBs | ||
| Entrez Gene ID | 814866 |
|
| Refseq ID (protein) | NP_001325194.1 | |
| NP_178436.2 | |
|
The preparation time of this page was 0.1 [sec].