[←][→] ath
| functional annotation | |||||||||||||||||||||||||||||||
| Function | GDSL-like Lipase/Acylhydrolase superfamily protein |


|
|||||||||||||||||||||||||||||
| GO BP |
|
||||||||||||||||||||||||||||||
| GO CC |
|
||||||||||||||||||||||||||||||
| GO MF |
|
||||||||||||||||||||||||||||||
| KEGG | |||||||||||||||||||||||||||||||
| Protein | NP_001318195.1 NP_001325155.1 NP_001325156.1 NP_178483.1 | ||||||||||||||||||||||||||||||
| BLAST | NP_001318195.1 NP_001325155.1 NP_001325156.1 NP_178483.1 | ||||||||||||||||||||||||||||||
| Orthologous | [Ortholog page] AT2G04020 (ath) LOC11417746 (mtr) LOC25479534 (mtr) LOC25488411 (mtr) LOC100241245 (vvi) LOC100781124 (gma) LOC100797896 (gma) LOC103839377 (bra) LOC103853919 (bra) LOC103875376 (bra) | ||||||||||||||||||||||||||||||
| Subcellular localization wolf |
|
||||||||||||||||||||||||||||||
| Subcellular localization TargetP |
|
||||||||||||||||||||||||||||||
| Gene coexpression | |||||||||||||||||||||||||||||||
| Network*for coexpressed genes |
|
||||||||||||||||||||||||||||||
|---|---|---|---|---|---|---|---|---|---|---|---|---|---|---|---|---|---|---|---|---|---|---|---|---|---|---|---|---|---|---|---|
| Coexpressed gene list |
[Coexpressed gene list for AT2G03980] | ||||||||||||||||||||||||||||||
| Gene expression | |||||||||||||||||||||||||||||||
| All samples | [Expression pattern for all samples] | ||||||||||||||||||||||||||||||
| AtGenExpress* (Development) |
263482_at
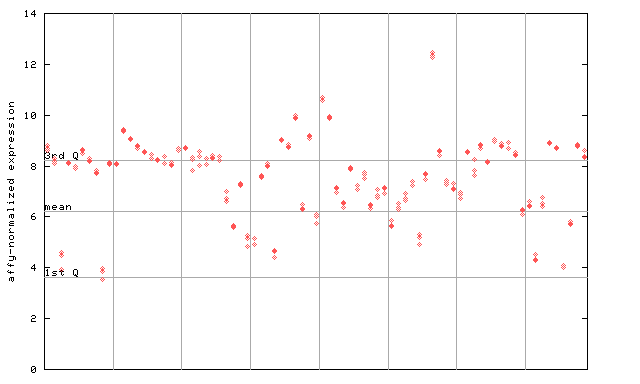
X axis is samples (pdf file), and Y axis is log2-expression. |
||||||||||||||||||||||||||||||
| AtGenExpress* (Stress) |
263482_at
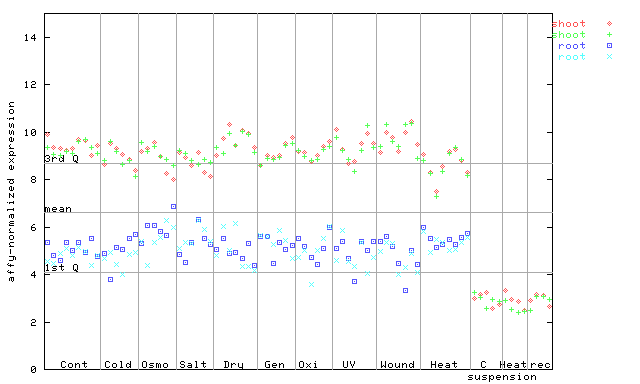
X axis is samples (pdf file), and Y axis is log2-expression. |
||||||||||||||||||||||||||||||
| AtGenExpress* (Hormone) |
263482_at
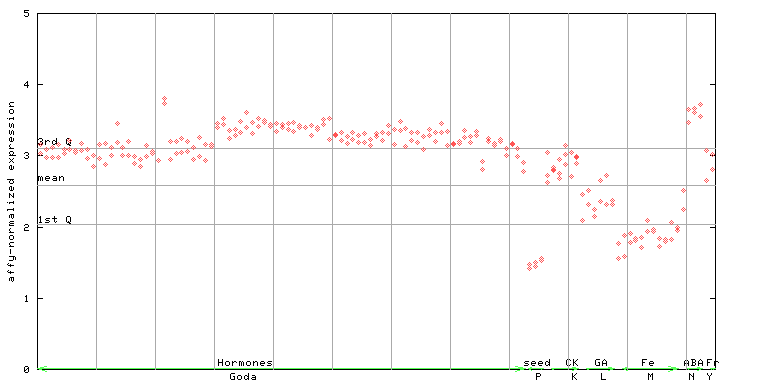
X axis is samples (xls file), and Y axis is log-expression. |
||||||||||||||||||||||||||||||


| Link to other DBs | ||
| Entrez Gene ID | 814924 |
|
| Refseq ID (protein) | NP_001318195.1 | |
| NP_001325155.1 | |
|
| NP_001325156.1 | |
|
| NP_178483.1 | |
|
The preparation time of this page was 0.2 [sec].