[←][→] ath
| functional annotation | |||||||||||||||||||||||||||||||||||||||||
| Function | beta-1,2-N-acetylglucosaminyltransferase II |


|
|||||||||||||||||||||||||||||||||||||||
| GO BP |
|
||||||||||||||||||||||||||||||||||||||||
| GO CC |
|
||||||||||||||||||||||||||||||||||||||||
| GO MF |
|
||||||||||||||||||||||||||||||||||||||||
| KEGG | ath00510 [list] [network] N-Glycan biosynthesis (46 genes) |  |
|||||||||||||||||||||||||||||||||||||||
| ath00513 [list] [network] Various types of N-glycan biosynthesis (32 genes) | |
||||||||||||||||||||||||||||||||||||||||
| Protein | NP_178601.2 | ||||||||||||||||||||||||||||||||||||||||
| BLAST | NP_178601.2 | ||||||||||||||||||||||||||||||||||||||||
| Orthologous | [Ortholog page] LOC7456009 (ppo) LOC9266501 (osa) LOC25483041 (mtr) LOC100819421 (gma) LOC101259650 (sly) LOC103860332 (bra) LOC123139160 (tae) LOC123145934 (tae) LOC123405812 (hvu) | ||||||||||||||||||||||||||||||||||||||||
| Subcellular localization wolf |
|
||||||||||||||||||||||||||||||||||||||||
| Subcellular localization TargetP |
|
||||||||||||||||||||||||||||||||||||||||
| Gene coexpression | |||||||||||||||||||||||||||||||||||||||||
| Network*for coexpressed genes |
|
||||||||||||||||||||||||||||||||||||||||
|---|---|---|---|---|---|---|---|---|---|---|---|---|---|---|---|---|---|---|---|---|---|---|---|---|---|---|---|---|---|---|---|---|---|---|---|---|---|---|---|---|---|
| Coexpressed gene list |
[Coexpressed gene list for AT2G05320] | ||||||||||||||||||||||||||||||||||||||||
| Gene expression | |||||||||||||||||||||||||||||||||||||||||
| All samples | [Expression pattern for all samples] | ||||||||||||||||||||||||||||||||||||||||
| AtGenExpress* (Development) |
263105_at
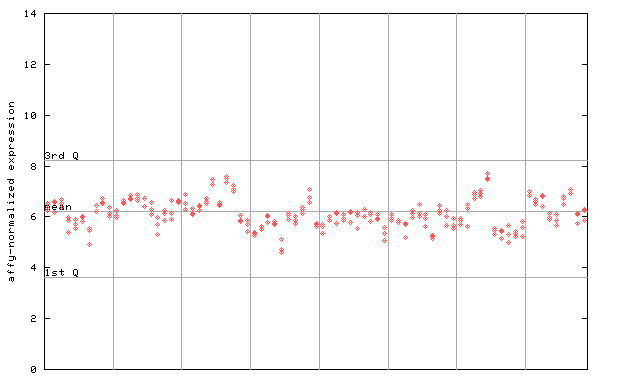
X axis is samples (pdf file), and Y axis is log2-expression. |
||||||||||||||||||||||||||||||||||||||||
| AtGenExpress* (Stress) |
263105_at
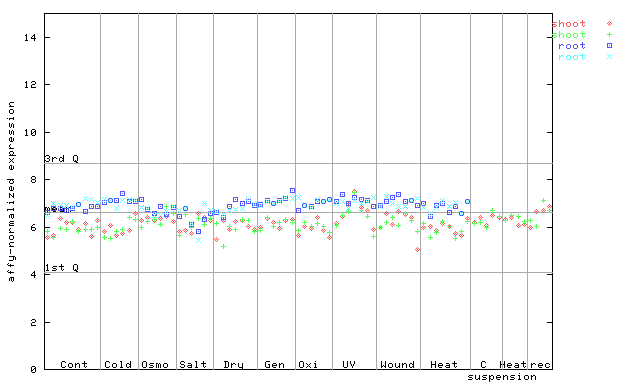
X axis is samples (pdf file), and Y axis is log2-expression. |
||||||||||||||||||||||||||||||||||||||||
| AtGenExpress* (Hormone) |
263105_at
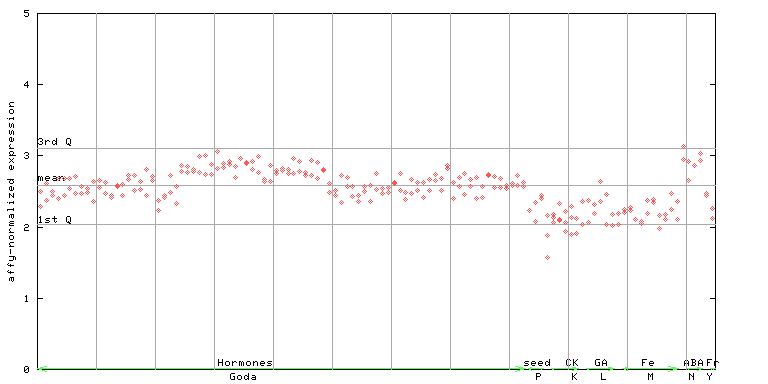
X axis is samples (xls file), and Y axis is log-expression. |
||||||||||||||||||||||||||||||||||||||||


| Link to other DBs | ||
| Entrez Gene ID | 815080 |
|
| Refseq ID (protein) | NP_178601.2 | |
The preparation time of this page was 0.5 [sec].