[←][→] ath
| functional annotation | |||||||||||||||||||||||||||||||
| Function | proton gradient regulation 5 |


|
|||||||||||||||||||||||||||||
| GO BP |
|
||||||||||||||||||||||||||||||
| GO CC |
|
||||||||||||||||||||||||||||||
| GO MF |
|
||||||||||||||||||||||||||||||
| KEGG | |||||||||||||||||||||||||||||||
| Protein | NP_001318202.1 NP_565327.1 | ||||||||||||||||||||||||||||||
| BLAST | NP_001318202.1 NP_565327.1 | ||||||||||||||||||||||||||||||
| Orthologous | [Ortholog page] LOC4346358 (osa) LOC7459985 (ppo) LOC7480884 (ppo) LOC11434471 (mtr) LOC100500247 (gma) LOC100782797 (gma) LOC101262255 (sly) LOC103860336 (bra) LOC123154066 (tae) LOC123161281 (tae) LOC123169118 (tae) LOC123409139 (hvu) | ||||||||||||||||||||||||||||||
| Subcellular localization wolf |
|
||||||||||||||||||||||||||||||
| Subcellular localization TargetP |
|
||||||||||||||||||||||||||||||
| Gene coexpression | |||||||||||||||||||||||||||||||
| Network*for coexpressed genes |
|
||||||||||||||||||||||||||||||
|---|---|---|---|---|---|---|---|---|---|---|---|---|---|---|---|---|---|---|---|---|---|---|---|---|---|---|---|---|---|---|---|
| Coexpressed gene list |
[Coexpressed gene list for PGR5] | ||||||||||||||||||||||||||||||
| Gene expression | |||||||||||||||||||||||||||||||
| All samples | [Expression pattern for all samples] | ||||||||||||||||||||||||||||||
| AtGenExpress* (Development) |
265569_at
X axis is samples (pdf file), and Y axis is log2-expression. |
||||||||||||||||||||||||||||||
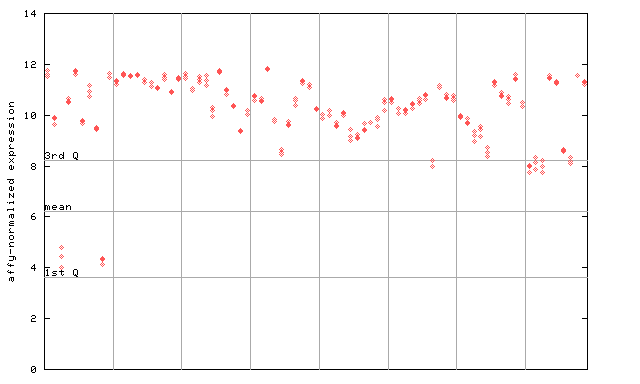
| AtGenExpress* (Stress) |
265569_at
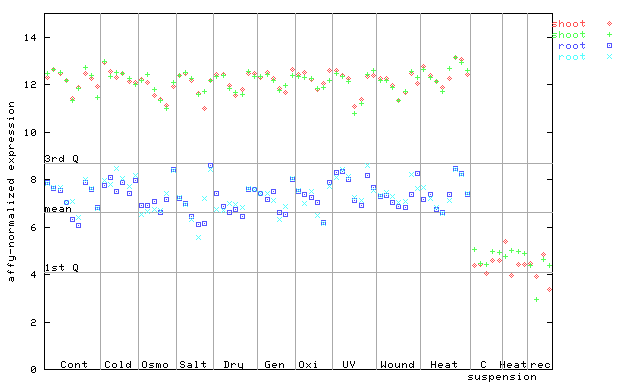
X axis is samples (pdf file), and Y axis is log2-expression. |
||||||||||||||||||||||||||||||
| AtGenExpress* (Hormone) |
265569_at
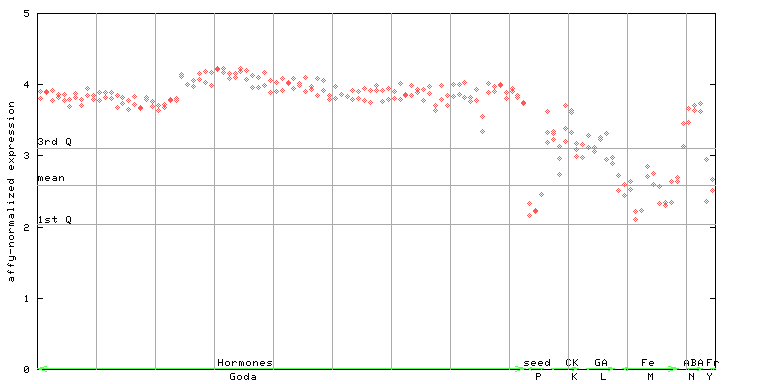
X axis is samples (xls file), and Y axis is log-expression. |
||||||||||||||||||||||||||||||


| Link to other DBs | ||
| Entrez Gene ID | 815111 |
|
| Refseq ID (protein) | NP_001318202.1 | |
| NP_565327.1 | |
|
The preparation time of this page was 0.2 [sec].