[←][→] ath
| functional annotation | ||||||||||||||||||||||||||
| Function | xyloglucan endotransglucosylase/hydrolase 10 |


|
||||||||||||||||||||||||
| GO BP |
|
|||||||||||||||||||||||||
| GO CC |
|
|||||||||||||||||||||||||
| GO MF |
|
|||||||||||||||||||||||||
| KEGG | ||||||||||||||||||||||||||
| Protein | NP_001324911.1 NP_001324912.1 NP_179069.1 | |||||||||||||||||||||||||
| BLAST | NP_001324911.1 NP_001324912.1 NP_179069.1 | |||||||||||||||||||||||||
| Orthologous | [Ortholog page] LOC7478762 (ppo) LOC25485295 (mtr) LOC100783152 (gma) LOC100793169 (gma) LOC101257904 (sly) LOC103847929 (bra) | |||||||||||||||||||||||||
| Subcellular localization wolf |
|
|||||||||||||||||||||||||
| Subcellular localization TargetP |
|
|||||||||||||||||||||||||
| Gene coexpression | ||||||||||||||||||||||||||
| Network*for coexpressed genes |
|
|||||||||||||||||||||||||
|---|---|---|---|---|---|---|---|---|---|---|---|---|---|---|---|---|---|---|---|---|---|---|---|---|---|---|
| Coexpressed gene list |
[Coexpressed gene list for XTH10] | |||||||||||||||||||||||||
| Gene expression | ||||||||||||||||||||||||||
| All samples | [Expression pattern for all samples] | |||||||||||||||||||||||||
| AtGenExpress* (Development) |
266376_at
X axis is samples (pdf file), and Y axis is log2-expression. |
|||||||||||||||||||||||||
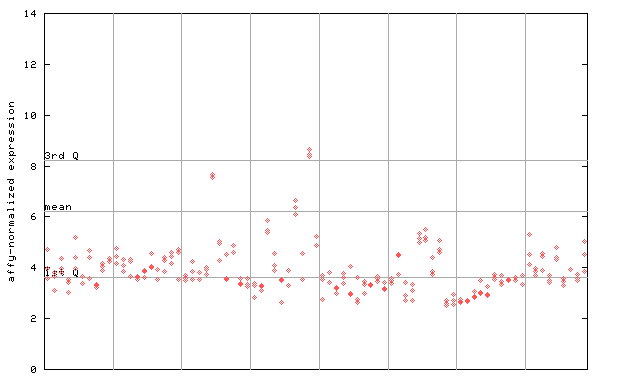
| AtGenExpress* (Stress) |
266376_at
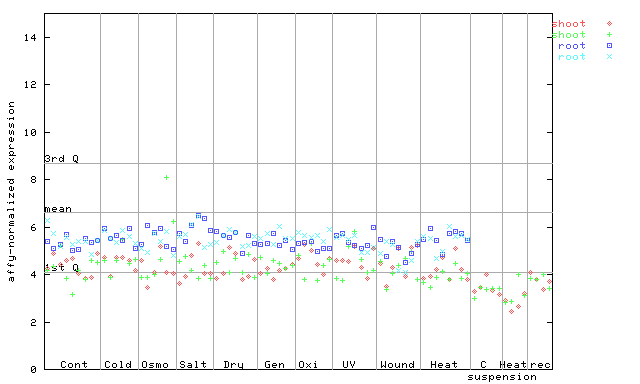
X axis is samples (pdf file), and Y axis is log2-expression. |
|||||||||||||||||||||||||
| AtGenExpress* (Hormone) |
266376_at
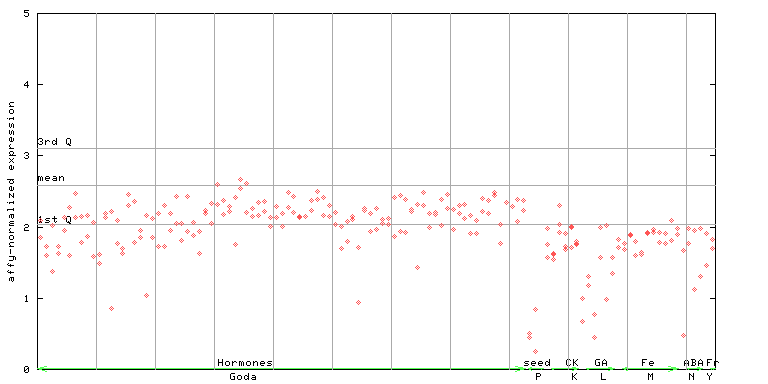
X axis is samples (xls file), and Y axis is log-expression. |
|||||||||||||||||||||||||


| Link to other DBs | ||
| Entrez Gene ID | 815950 |
|
| Refseq ID (protein) | NP_001324911.1 | |
| NP_001324912.1 | |
|
| NP_179069.1 | |
|
The preparation time of this page was 0.1 [sec].