[←][→] ath
| functional annotation | ||||||||||||||||||||||||||||||||||||||||||||||||
| Function | coiled-coil 90B-like protein (DUF1640) |


|
||||||||||||||||||||||||||||||||||||||||||||||
| GO BP |
|
|||||||||||||||||||||||||||||||||||||||||||||||
| GO CC |
|
|||||||||||||||||||||||||||||||||||||||||||||||
| GO MF |
|
|||||||||||||||||||||||||||||||||||||||||||||||
| KEGG | ||||||||||||||||||||||||||||||||||||||||||||||||
| Protein | NP_565388.1 NP_973473.1 | |||||||||||||||||||||||||||||||||||||||||||||||
| BLAST | NP_565388.1 NP_973473.1 | |||||||||||||||||||||||||||||||||||||||||||||||
| Orthologous | [Ortholog page] LOC4342051 (osa) LOC7494300 (ppo) LOC11407545 (mtr) LOC11408166 (mtr) LOC11418221 (mtr) LOC100806915 (gma) LOC100810837 (gma) LOC101248055 (sly) LOC101249697 (sly) LOC101257811 (sly) LOC103837768 (bra) LOC123148254 (tae) LOC123156896 (tae) LOC123165635 (tae) LOC123411000 (hvu) | |||||||||||||||||||||||||||||||||||||||||||||||
| Subcellular localization wolf |
|
|||||||||||||||||||||||||||||||||||||||||||||||
| Subcellular localization TargetP |
|
|||||||||||||||||||||||||||||||||||||||||||||||
| Gene coexpression | ||||||||||||||||||||||||||||||||||||||||||||||||
| Network*for coexpressed genes |
|
|||||||||||||||||||||||||||||||||||||||||||||||
|---|---|---|---|---|---|---|---|---|---|---|---|---|---|---|---|---|---|---|---|---|---|---|---|---|---|---|---|---|---|---|---|---|---|---|---|---|---|---|---|---|---|---|---|---|---|---|---|---|
| Coexpressed gene list |
[Coexpressed gene list for AT2G16460] | |||||||||||||||||||||||||||||||||||||||||||||||
| Gene expression | ||||||||||||||||||||||||||||||||||||||||||||||||
| All samples | [Expression pattern for all samples] | |||||||||||||||||||||||||||||||||||||||||||||||
| AtGenExpress* (Development) |
263555_at
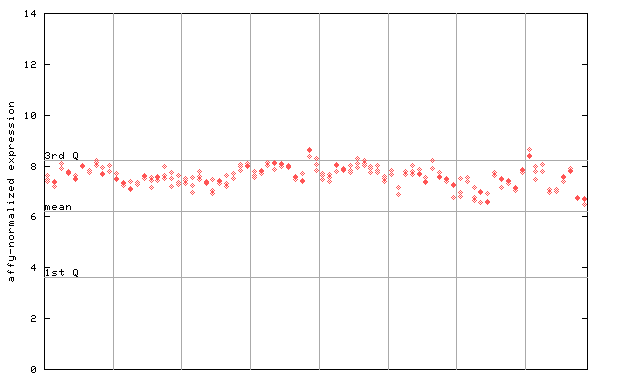
X axis is samples (pdf file), and Y axis is log2-expression. |
|||||||||||||||||||||||||||||||||||||||||||||||
| AtGenExpress* (Stress) |
263555_at
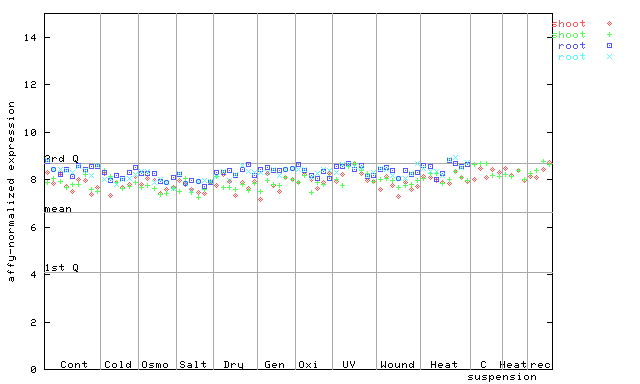
X axis is samples (pdf file), and Y axis is log2-expression. |
|||||||||||||||||||||||||||||||||||||||||||||||
| AtGenExpress* (Hormone) |
263555_at
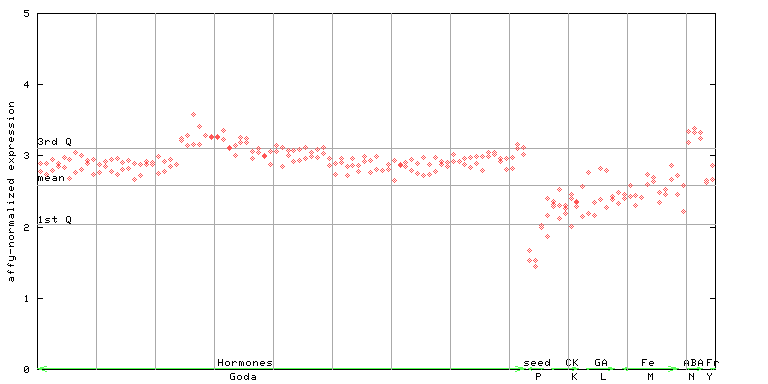
X axis is samples (xls file), and Y axis is log-expression. |
|||||||||||||||||||||||||||||||||||||||||||||||


")
")
| Link to other DBs | ||
| Entrez Gene ID | 816144 |
|
| Refseq ID (protein) | NP_565388.1 | |
| NP_973473.1 | |
|
The preparation time of this page was 0.1 [sec].