[←][→] ath
| functional annotation | ||||||||||||||||||||||||||
| Function | histone H1-3 |


|
||||||||||||||||||||||||
| GO BP |
|
|||||||||||||||||||||||||
| GO CC |
|
|||||||||||||||||||||||||
| GO MF |
|
|||||||||||||||||||||||||
| KEGG | ||||||||||||||||||||||||||
| Protein | NP_179396.1 NP_849970.1 | |||||||||||||||||||||||||
| BLAST | NP_179396.1 NP_849970.1 | |||||||||||||||||||||||||
| Orthologous | [Ortholog page] LOC541973 (zma) LOC544142 (sly) LOC4335314 (osa) LOC4340005 (osa) LOC7480170 (ppo) LOC11429395 (mtr) LOC100254064 (vvi) LOC100500169 (gma) LOC100797229 (gma) LOC103638138 (zma) LOC103837838 (bra) | |||||||||||||||||||||||||
| Subcellular localization wolf |
|
|||||||||||||||||||||||||
| Subcellular localization TargetP |
|
|||||||||||||||||||||||||
| Gene coexpression | ||||||||||||||||||||||||||
| Network*for coexpressed genes |
|
|||||||||||||||||||||||||
|---|---|---|---|---|---|---|---|---|---|---|---|---|---|---|---|---|---|---|---|---|---|---|---|---|---|---|
| Coexpressed gene list |
[Coexpressed gene list for HIS1-3] | |||||||||||||||||||||||||
| Gene expression | ||||||||||||||||||||||||||
| All samples | [Expression pattern for all samples] | |||||||||||||||||||||||||
| AtGenExpress* (Development) |
265817_at
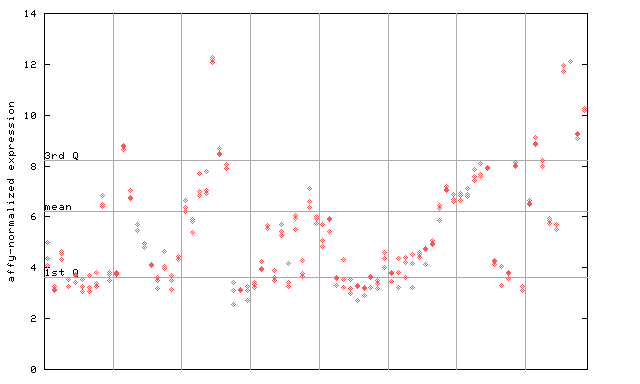
X axis is samples (pdf file), and Y axis is log2-expression. |
|||||||||||||||||||||||||
| AtGenExpress* (Stress) |
265817_at
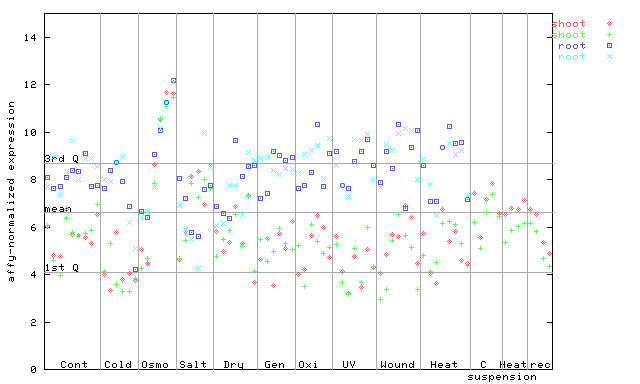
X axis is samples (pdf file), and Y axis is log2-expression. |
|||||||||||||||||||||||||
| AtGenExpress* (Hormone) |
265817_at
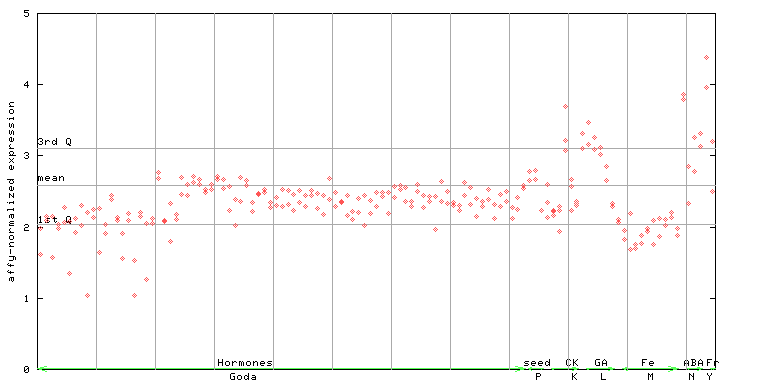
X axis is samples (xls file), and Y axis is log-expression. |
|||||||||||||||||||||||||


| Link to other DBs | ||
| Entrez Gene ID | 816317 |
|
| Refseq ID (protein) | NP_179396.1 | |
| NP_849970.1 | |
|
The preparation time of this page was 0.2 [sec].