[←][→] ath
| functional annotation | ||||||||||||||||||||||||||
| Function | SECY homolog 1 |


|
||||||||||||||||||||||||
| GO BP |
|
|||||||||||||||||||||||||
| GO CC |
|
|||||||||||||||||||||||||
| GO MF |
|
|||||||||||||||||||||||||
| KEGG | ath03060 [list] [network] Protein export (54 genes) |  |
||||||||||||||||||||||||
| ath04141 [list] [network] Protein processing in endoplasmic reticulum (215 genes) | |
|||||||||||||||||||||||||
| ath04145 [list] [network] Phagosome (83 genes) | |
|||||||||||||||||||||||||
| Protein | NP_179461.1 | |||||||||||||||||||||||||
| BLAST | NP_179461.1 | |||||||||||||||||||||||||
| Orthologous | [Ortholog page] LOC4345097 (osa) LOC7465997 (ppo) LOC7493346 (ppo) LOC25488366 (mtr) LOC100810430 (gma) LOC101263722 (sly) LOC103828373 (bra) LOC123103281 (tae) LOC123111470 (tae) LOC123120625 (tae) LOC123399075 (hvu) | |||||||||||||||||||||||||
| Subcellular localization wolf |
|
|||||||||||||||||||||||||
| Subcellular localization TargetP |
|
|||||||||||||||||||||||||
| Gene coexpression | ||||||||||||||||||||||||||
| Network*for coexpressed genes |
|
|||||||||||||||||||||||||
|---|---|---|---|---|---|---|---|---|---|---|---|---|---|---|---|---|---|---|---|---|---|---|---|---|---|---|
| Coexpressed gene list |
[Coexpressed gene list for SCY1] | |||||||||||||||||||||||||
| Gene expression | ||||||||||||||||||||||||||
| All samples | [Expression pattern for all samples] | |||||||||||||||||||||||||
| AtGenExpress* (Development) |
266018_at
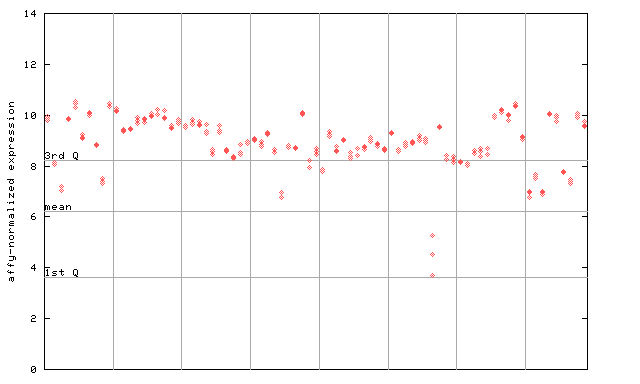
X axis is samples (pdf file), and Y axis is log2-expression. |
|||||||||||||||||||||||||
| AtGenExpress* (Stress) |
266018_at
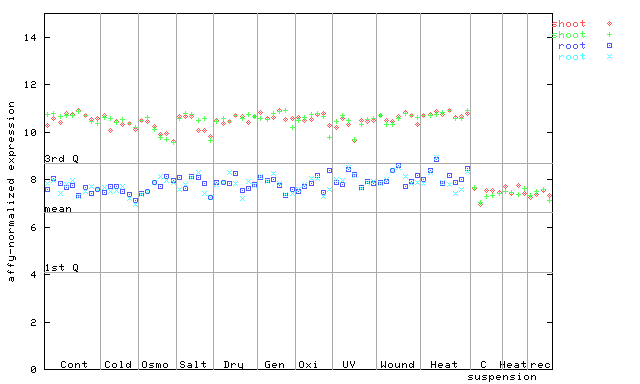
X axis is samples (pdf file), and Y axis is log2-expression. |
|||||||||||||||||||||||||
| AtGenExpress* (Hormone) |
266018_at
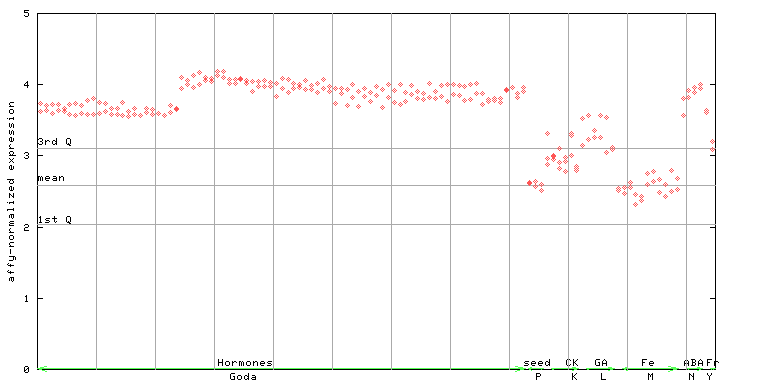
X axis is samples (xls file), and Y axis is log-expression. |
|||||||||||||||||||||||||


| Link to other DBs | ||
| Entrez Gene ID | 816386 |
|
| Refseq ID (protein) | NP_179461.1 | |
The preparation time of this page was 0.1 [sec].