[←][→] ath
| functional annotation | ||||||||||
| Function | GDSL-like Lipase/Acylhydrolase superfamily protein |


|
||||||||
| GO BP |
|
|||||||||
| GO CC |
|
|||||||||
| GO MF |
|
|||||||||
| KEGG | ||||||||||
| Protein | NP_001323809.1 NP_179495.1 | |||||||||
| BLAST | NP_001323809.1 NP_179495.1 | |||||||||
| Orthologous | [Ortholog page] AT2G19060 (ath) LOC103868713 (bra) LOC103874055 (bra) | |||||||||
| Subcellular localization wolf |
|
|||||||||
| Subcellular localization TargetP |
|
|||||||||
| Gene coexpression | ||||||||||
| Network*for coexpressed genes |
||||||||||
|---|---|---|---|---|---|---|---|---|---|---|
| Coexpressed gene list |
[Coexpressed gene list for AT2G19050] | |||||||||
| Gene expression | ||||||||||
| All samples | [Expression pattern for all samples] | |||||||||
| AtGenExpress* (Development) |
267438_at
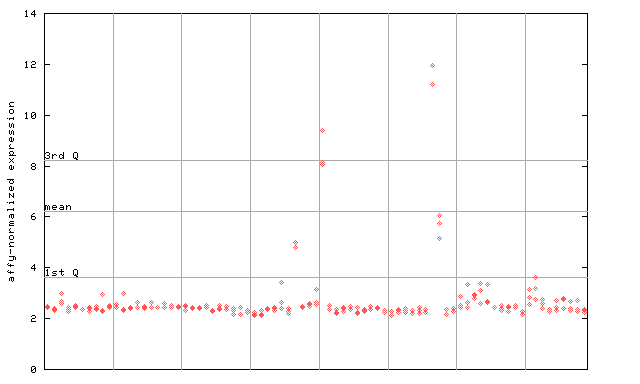
X axis is samples (pdf file), and Y axis is log2-expression. |
|||||||||
| AtGenExpress* (Stress) |
267438_at
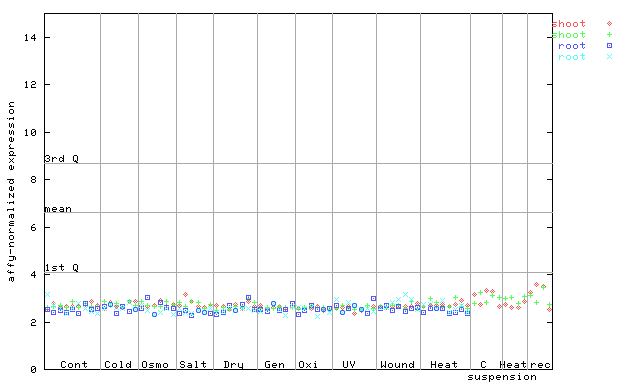
X axis is samples (pdf file), and Y axis is log2-expression. |
|||||||||
| AtGenExpress* (Hormone) |
267438_at
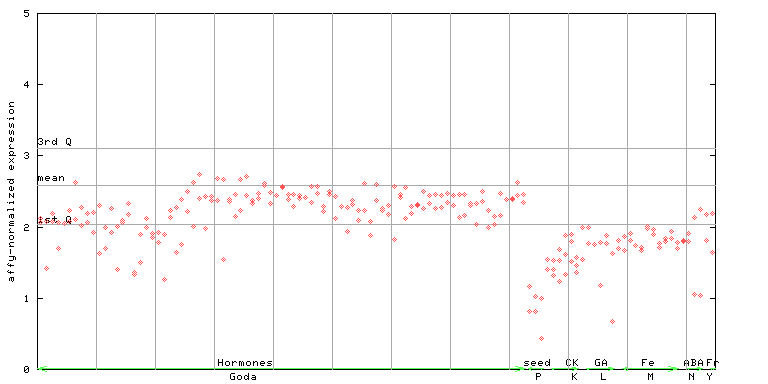
X axis is samples (xls file), and Y axis is log-expression. |
|||||||||

| Link to other DBs | ||
| Entrez Gene ID | 816422 |
|
| Refseq ID (protein) | NP_001323809.1 | |
| NP_179495.1 | |
|
The preparation time of this page was 0.1 [sec].