[←][→] ath
| functional annotation | ||||||||||||||||||||||||||||||||||||||||||||||||||||||||||||||||||||||
| Function | ATP citrate lyase (ACL) family protein |


|
||||||||||||||||||||||||||||||||||||||||||||||||||||||||||||||||||||
| GO BP |
|
|||||||||||||||||||||||||||||||||||||||||||||||||||||||||||||||||||||
| GO CC |
|
|||||||||||||||||||||||||||||||||||||||||||||||||||||||||||||||||||||
| GO MF |
|
|||||||||||||||||||||||||||||||||||||||||||||||||||||||||||||||||||||
| KEGG | ath00020 [list] [network] Citrate cycle (TCA cycle) (64 genes) |  |
||||||||||||||||||||||||||||||||||||||||||||||||||||||||||||||||||||
| ath00640 [list] [network] Propanoate metabolism (41 genes) | |
|||||||||||||||||||||||||||||||||||||||||||||||||||||||||||||||||||||
| ath01200 [list] [network] Carbon metabolism (273 genes) | |
|||||||||||||||||||||||||||||||||||||||||||||||||||||||||||||||||||||
| Protein | NP_179632.1 | |||||||||||||||||||||||||||||||||||||||||||||||||||||||||||||||||||||
| BLAST | NP_179632.1 | |||||||||||||||||||||||||||||||||||||||||||||||||||||||||||||||||||||
| Orthologous | [Ortholog page] LOC543863 (sly) LOC4330016 (osa) LOC7455712 (ppo) LOC7474514 (ppo) LOC25484225 (mtr) LOC100527938 (gma) LOC100790952 (gma) LOC103828176 (bra) LOC103838252 (bra) LOC123127746 (tae) LOC123137501 (tae) LOC123144854 (tae) LOC123401334 (hvu) | |||||||||||||||||||||||||||||||||||||||||||||||||||||||||||||||||||||
| Subcellular localization wolf |
|
|||||||||||||||||||||||||||||||||||||||||||||||||||||||||||||||||||||
| Subcellular localization TargetP |
|
|||||||||||||||||||||||||||||||||||||||||||||||||||||||||||||||||||||
| Gene coexpression | ||||||||||||||||||||||||||||||||||||||||||||||||||||||||||||||||||||||
| Network*for coexpressed genes |
|
|||||||||||||||||||||||||||||||||||||||||||||||||||||||||||||||||||||
|---|---|---|---|---|---|---|---|---|---|---|---|---|---|---|---|---|---|---|---|---|---|---|---|---|---|---|---|---|---|---|---|---|---|---|---|---|---|---|---|---|---|---|---|---|---|---|---|---|---|---|---|---|---|---|---|---|---|---|---|---|---|---|---|---|---|---|---|---|---|---|
| Coexpressed gene list |
[Coexpressed gene list for AT2G20420] | |||||||||||||||||||||||||||||||||||||||||||||||||||||||||||||||||||||
| Gene expression | ||||||||||||||||||||||||||||||||||||||||||||||||||||||||||||||||||||||
| All samples | [Expression pattern for all samples] | |||||||||||||||||||||||||||||||||||||||||||||||||||||||||||||||||||||
| AtGenExpress* (Development) |
265257_at
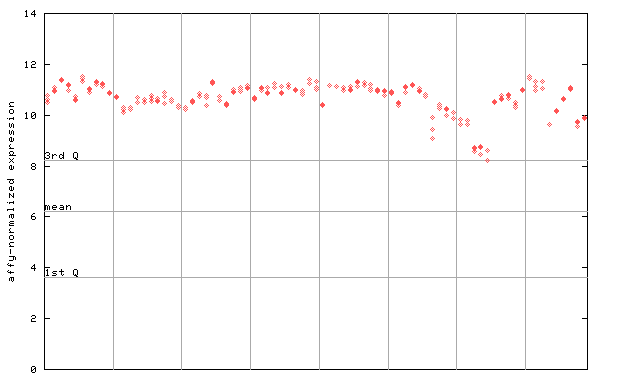
X axis is samples (pdf file), and Y axis is log2-expression. |
|||||||||||||||||||||||||||||||||||||||||||||||||||||||||||||||||||||
| AtGenExpress* (Stress) |
265257_at
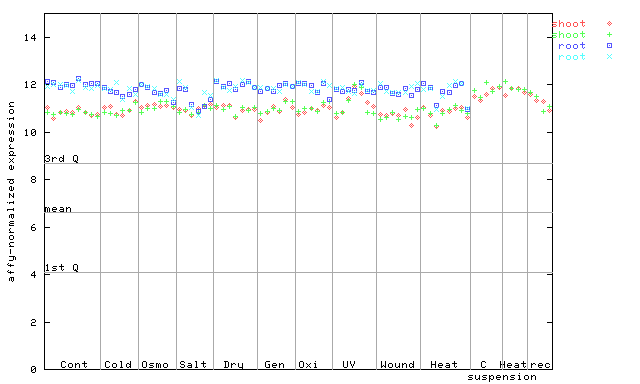
X axis is samples (pdf file), and Y axis is log2-expression. |
|||||||||||||||||||||||||||||||||||||||||||||||||||||||||||||||||||||
| AtGenExpress* (Hormone) |
265257_at
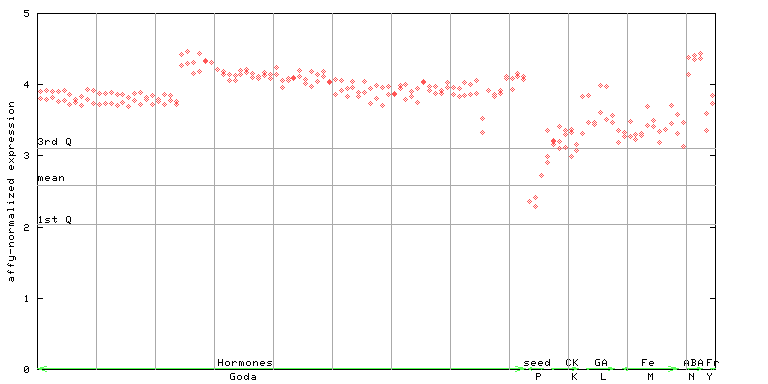
X axis is samples (xls file), and Y axis is log-expression. |
|||||||||||||||||||||||||||||||||||||||||||||||||||||||||||||||||||||


")
")
")
")
")
| Link to other DBs | ||
| Entrez Gene ID | 816561 |
|
| Refseq ID (protein) | NP_179632.1 | |
The preparation time of this page was 0.1 [sec].