[←][→] ath
| functional annotation | |||||||||||||||||||||||||||||||||||||||
| Function | uncharacterized protein |


|
|||||||||||||||||||||||||||||||||||||
| GO BP |
|
||||||||||||||||||||||||||||||||||||||
| GO CC |
|
||||||||||||||||||||||||||||||||||||||
| GO MF |
|
||||||||||||||||||||||||||||||||||||||
| KEGG | |||||||||||||||||||||||||||||||||||||||
| Protein | NP_565523.1 | ||||||||||||||||||||||||||||||||||||||
| BLAST | NP_565523.1 | ||||||||||||||||||||||||||||||||||||||
| Orthologous | [Ortholog page] LOC4337160 (osa) LOC7477130 (ppo) LOC100306288 (gma) LOC100807209 (gma) LOC101250205 (sly) LOC103864311 (bra) LOC120577608 (mtr) LOC123047182 (tae) LOC123054989 (tae) LOC123190841 (tae) LOC123428212 (hvu) | ||||||||||||||||||||||||||||||||||||||
| Subcellular localization wolf |
|
||||||||||||||||||||||||||||||||||||||
| Subcellular localization TargetP |
|
||||||||||||||||||||||||||||||||||||||
| Gene coexpression | |||||||||||||||||||||||||||||||||||||||
| Network*for coexpressed genes |
|
||||||||||||||||||||||||||||||||||||||
|---|---|---|---|---|---|---|---|---|---|---|---|---|---|---|---|---|---|---|---|---|---|---|---|---|---|---|---|---|---|---|---|---|---|---|---|---|---|---|---|
| Coexpressed gene list |
[Coexpressed gene list for AT2G21960] | ||||||||||||||||||||||||||||||||||||||
| Gene expression | |||||||||||||||||||||||||||||||||||||||
| All samples | [Expression pattern for all samples] | ||||||||||||||||||||||||||||||||||||||
| AtGenExpress* (Development) |
263880_at
X axis is samples (pdf file), and Y axis is log2-expression. |
||||||||||||||||||||||||||||||||||||||
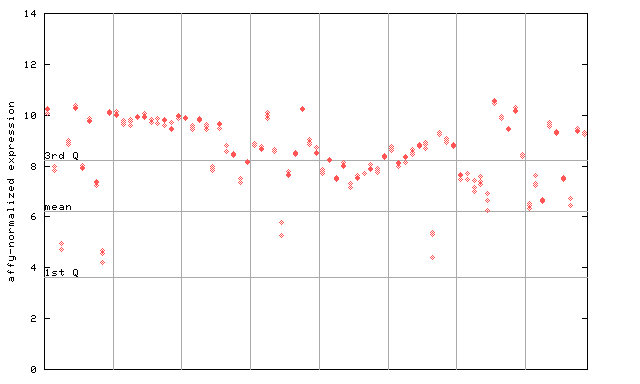
| AtGenExpress* (Stress) |
263880_at
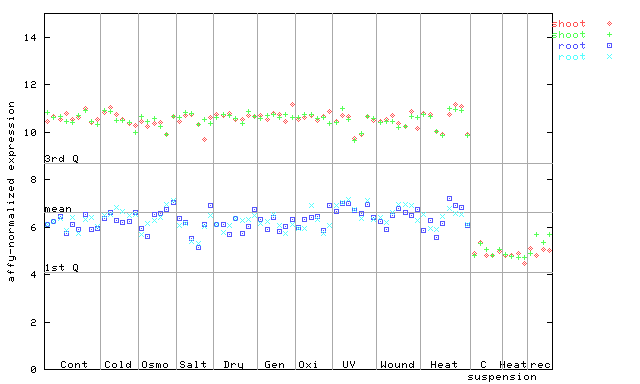
X axis is samples (pdf file), and Y axis is log2-expression. |
||||||||||||||||||||||||||||||||||||||
| AtGenExpress* (Hormone) |
263880_at
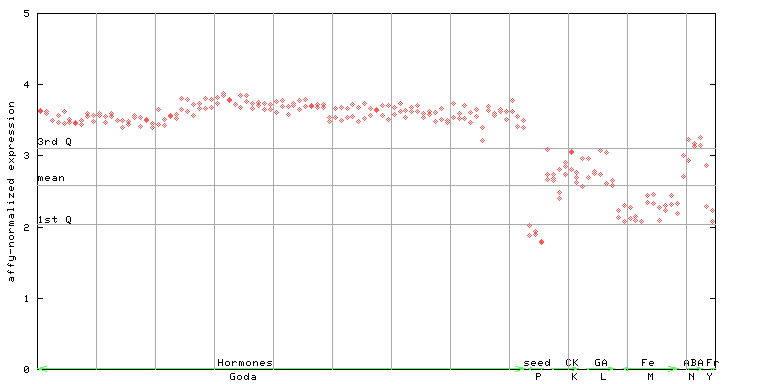
X axis is samples (xls file), and Y axis is log-expression. |
||||||||||||||||||||||||||||||||||||||


")
| Link to other DBs | ||
| Entrez Gene ID | 816732 |
|
| Refseq ID (protein) | NP_565523.1 | |
The preparation time of this page was 0.1 [sec].