[←][→] ath
| functional annotation | ||||||||||||||||||||||||||
| Function | SLOW GROWTH 1 |


|
||||||||||||||||||||||||
| GO BP |
|
|||||||||||||||||||||||||
| GO CC |
|
|||||||||||||||||||||||||
| GO MF |
|
|||||||||||||||||||||||||
| KEGG | ||||||||||||||||||||||||||
| Protein | NP_179827.1 | |||||||||||||||||||||||||
| BLAST | NP_179827.1 | |||||||||||||||||||||||||
| Orthologous | [Ortholog page] LOC7487029 (ppo) LOC9272050 (osa) LOC11434540 (mtr) LOC101255361 (sly) LOC103868580 (bra) LOC123153529 (tae) LOC123158147 (tae) LOC123166464 (tae) LOC123410508 (hvu) | |||||||||||||||||||||||||
| Subcellular localization wolf |
|
|||||||||||||||||||||||||
| Subcellular localization TargetP |
|
|||||||||||||||||||||||||
| Gene coexpression | ||||||||||||||||||||||||||
| Network*for coexpressed genes |
|
|||||||||||||||||||||||||
|---|---|---|---|---|---|---|---|---|---|---|---|---|---|---|---|---|---|---|---|---|---|---|---|---|---|---|
| Coexpressed gene list |
[Coexpressed gene list for SLO1] | |||||||||||||||||||||||||
| Gene expression | ||||||||||||||||||||||||||
| All samples | [Expression pattern for all samples] | |||||||||||||||||||||||||
| AtGenExpress* (Development) |
264047_at
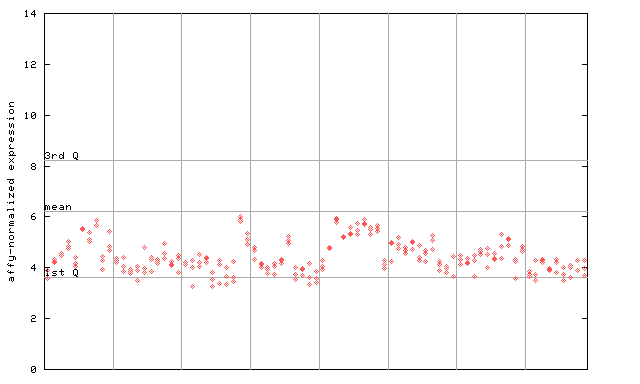
X axis is samples (pdf file), and Y axis is log2-expression. |
|||||||||||||||||||||||||
| AtGenExpress* (Stress) |
264047_at
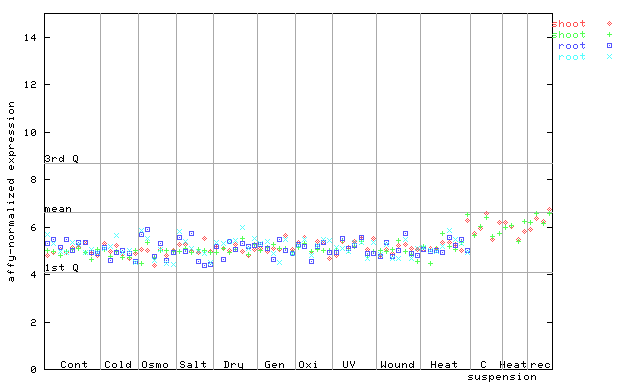
X axis is samples (pdf file), and Y axis is log2-expression. |
|||||||||||||||||||||||||
| AtGenExpress* (Hormone) |
264047_at
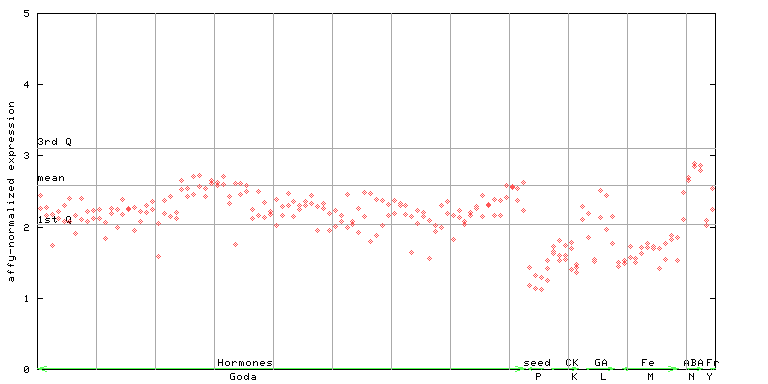
X axis is samples (xls file), and Y axis is log-expression. |
|||||||||||||||||||||||||


| Link to other DBs | ||
| Entrez Gene ID | 816772 |
|
| Refseq ID (protein) | NP_179827.1 | |
The preparation time of this page was 0.1 [sec].