[←][→] ath
| functional annotation | |||||||||||||||||||||||||||||||||||||||
| Function | DNA-binding protein phosphatase 1 |


|
|||||||||||||||||||||||||||||||||||||
| GO BP |
|
||||||||||||||||||||||||||||||||||||||
| GO CC |
|
||||||||||||||||||||||||||||||||||||||
| GO MF |
|
||||||||||||||||||||||||||||||||||||||
| KEGG | |||||||||||||||||||||||||||||||||||||||
| Protein | NP_001324148.1 NP_180133.1 | ||||||||||||||||||||||||||||||||||||||
| BLAST | NP_001324148.1 NP_180133.1 | ||||||||||||||||||||||||||||||||||||||
| Orthologous | [Ortholog page] LOC4341433 (osa) LOC7462968 (ppo) LOC7495749 (ppo) LOC11426779 (mtr) LOC100804558 (gma) LOC100815725 (gma) LOC101244964 (sly) LOC103842175 (bra) LOC123148121 (tae) LOC123157633 (tae) LOC123166127 (tae) LOC123409742 (hvu) | ||||||||||||||||||||||||||||||||||||||
| Subcellular localization wolf |
|
||||||||||||||||||||||||||||||||||||||
| Subcellular localization TargetP |
|
||||||||||||||||||||||||||||||||||||||
| Gene coexpression | |||||||||||||||||||||||||||||||||||||||
| Network*for coexpressed genes |
|
||||||||||||||||||||||||||||||||||||||
|---|---|---|---|---|---|---|---|---|---|---|---|---|---|---|---|---|---|---|---|---|---|---|---|---|---|---|---|---|---|---|---|---|---|---|---|---|---|---|---|
| Coexpressed gene list |
[Coexpressed gene list for DBP1] | ||||||||||||||||||||||||||||||||||||||
| Gene expression | |||||||||||||||||||||||||||||||||||||||
| All samples | [Expression pattern for all samples] | ||||||||||||||||||||||||||||||||||||||
| AtGenExpress* (Development) |
265886_at
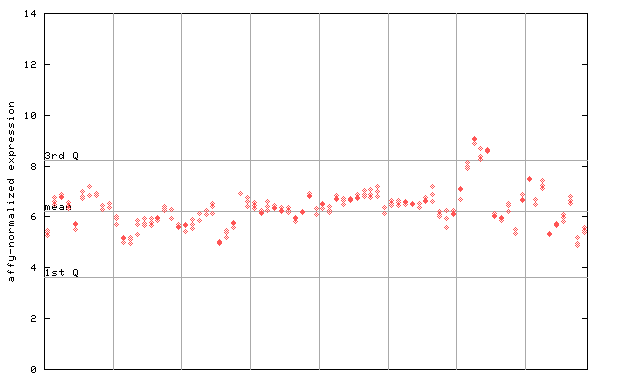
X axis is samples (pdf file), and Y axis is log2-expression. |
||||||||||||||||||||||||||||||||||||||
| AtGenExpress* (Stress) |
265886_at
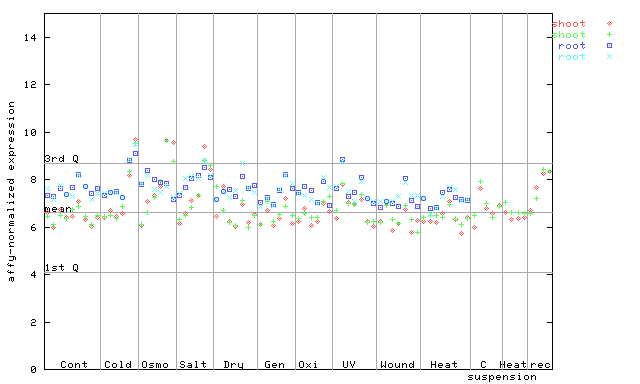
X axis is samples (pdf file), and Y axis is log2-expression. |
||||||||||||||||||||||||||||||||||||||
| AtGenExpress* (Hormone) |
265886_at
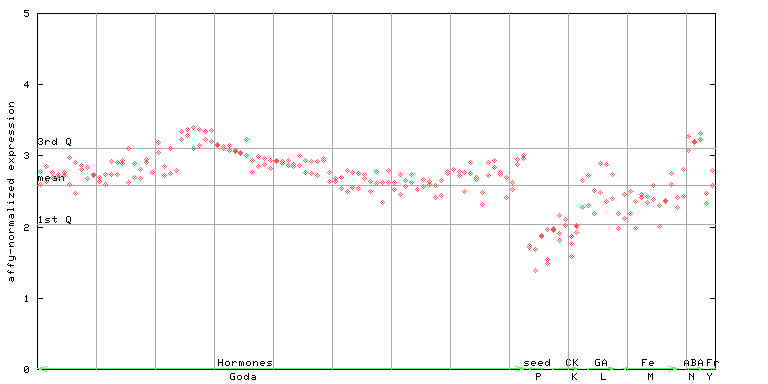
X axis is samples (xls file), and Y axis is log-expression. |
||||||||||||||||||||||||||||||||||||||


")
| Link to other DBs | ||
| Entrez Gene ID | 817102 |
|
| Refseq ID (protein) | NP_001324148.1 | |
| NP_180133.1 | |
|
The preparation time of this page was 0.1 [sec].