[←][→] ath
| functional annotation | ||||||||||||||||||||||||||||||||||||||||||||||||
| Function | uncharacterized protein |


|
||||||||||||||||||||||||||||||||||||||||||||||
| GO BP |
|
|||||||||||||||||||||||||||||||||||||||||||||||
| GO CC |
|
|||||||||||||||||||||||||||||||||||||||||||||||
| GO MF |
|
|||||||||||||||||||||||||||||||||||||||||||||||
| KEGG | ||||||||||||||||||||||||||||||||||||||||||||||||
| Protein | NP_001189608.1 NP_565620.2 | |||||||||||||||||||||||||||||||||||||||||||||||
| BLAST | NP_001189608.1 NP_565620.2 | |||||||||||||||||||||||||||||||||||||||||||||||
| Orthologous | [Ortholog page] LOC7492295 (ppo) LOC9266492 (osa) LOC11433497 (mtr) LOC100787776 (gma) LOC101268490 (sly) LOC103842091 (bra) LOC103842151 (bra) LOC123081552 (tae) LOC123089249 (tae) LOC123100325 (tae) LOC123447096 (hvu) | |||||||||||||||||||||||||||||||||||||||||||||||
| Subcellular localization wolf |
|
|||||||||||||||||||||||||||||||||||||||||||||||
| Subcellular localization TargetP |
|
|||||||||||||||||||||||||||||||||||||||||||||||
| Gene coexpression | ||||||||||||||||||||||||||||||||||||||||||||||||
| Network*for coexpressed genes |
|
|||||||||||||||||||||||||||||||||||||||||||||||
|---|---|---|---|---|---|---|---|---|---|---|---|---|---|---|---|---|---|---|---|---|---|---|---|---|---|---|---|---|---|---|---|---|---|---|---|---|---|---|---|---|---|---|---|---|---|---|---|---|
| Coexpressed gene list |
[Coexpressed gene list for AT2G26340] | |||||||||||||||||||||||||||||||||||||||||||||||
| Gene expression | ||||||||||||||||||||||||||||||||||||||||||||||||
| All samples | [Expression pattern for all samples] | |||||||||||||||||||||||||||||||||||||||||||||||
| AtGenExpress* (Development) |
267379_at
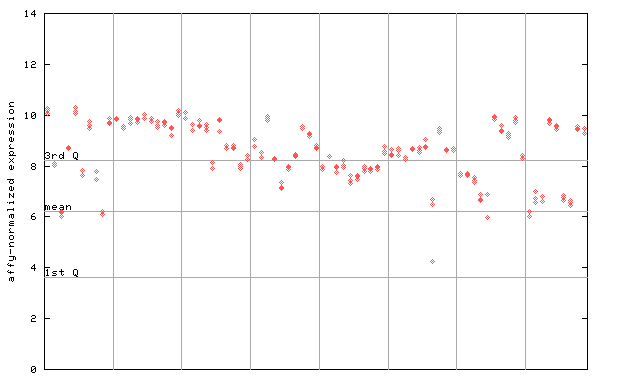
X axis is samples (pdf file), and Y axis is log2-expression. |
|||||||||||||||||||||||||||||||||||||||||||||||
| AtGenExpress* (Stress) |
267379_at
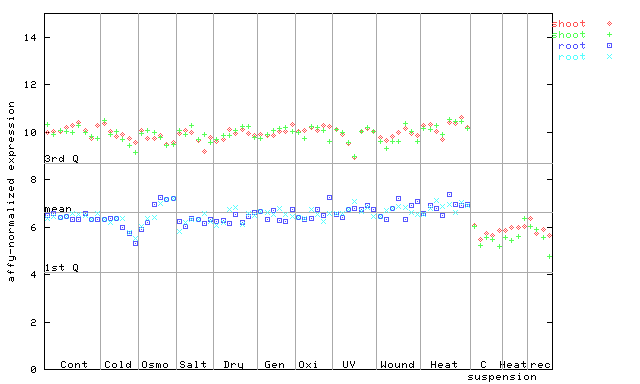
X axis is samples (pdf file), and Y axis is log2-expression. |
|||||||||||||||||||||||||||||||||||||||||||||||
| AtGenExpress* (Hormone) |
267379_at
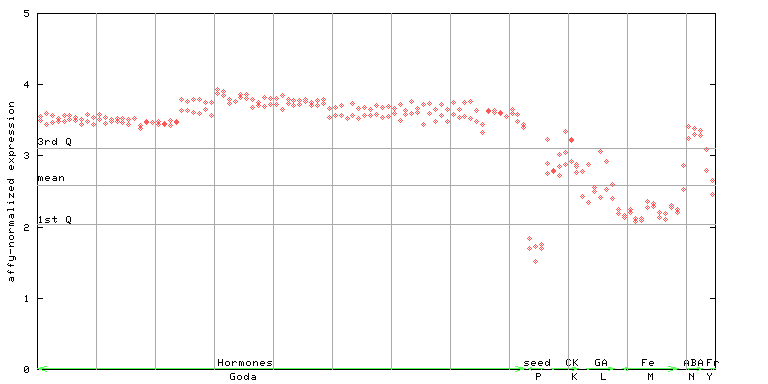
X axis is samples (xls file), and Y axis is log-expression. |
|||||||||||||||||||||||||||||||||||||||||||||||


")
")
| Link to other DBs | ||
| Entrez Gene ID | 817174 |
|
| Refseq ID (protein) | NP_001189608.1 | |
| NP_565620.2 | |
|
The preparation time of this page was 0.1 [sec].