[←][→] ath
| functional annotation | ||||||||||||||||||||||||||||||||||
| Function | non-specific phospholipase C2 |


|
||||||||||||||||||||||||||||||||
| GO BP |
|
|||||||||||||||||||||||||||||||||
| GO CC |
|
|||||||||||||||||||||||||||||||||
| GO MF |
|
|||||||||||||||||||||||||||||||||
| KEGG | ath00562 [list] [network] Inositol phosphate metabolism (79 genes) |  |
||||||||||||||||||||||||||||||||
| ath00564 [list] [network] Glycerophospholipid metabolism (99 genes) | |
|||||||||||||||||||||||||||||||||
| ath00565 [list] [network] Ether lipid metabolism (26 genes) | |
|||||||||||||||||||||||||||||||||
| Protein | NP_180255.1 | |||||||||||||||||||||||||||||||||
| BLAST | NP_180255.1 | |||||||||||||||||||||||||||||||||
| Orthologous | [Ortholog page] LOC4325407 (osa) LOC7475026 (ppo) LOC7480121 (ppo) LOC25488861 (mtr) LOC100778146 (gma) LOC101259566 (sly) LOC103864845 (bra) LOC123063476 (tae) LOC123072550 (tae) LOC123072552 (tae) LOC123080764 (tae) LOC123445551 (hvu) | |||||||||||||||||||||||||||||||||
| Subcellular localization wolf |
|
|||||||||||||||||||||||||||||||||
| Subcellular localization TargetP |
|
|||||||||||||||||||||||||||||||||
| Gene coexpression | ||||||||||||||||||||||||||||||||||
| Network*for coexpressed genes |
|
|||||||||||||||||||||||||||||||||
|---|---|---|---|---|---|---|---|---|---|---|---|---|---|---|---|---|---|---|---|---|---|---|---|---|---|---|---|---|---|---|---|---|---|---|
| Coexpressed gene list |
[Coexpressed gene list for NPC2] | |||||||||||||||||||||||||||||||||
| Gene expression | ||||||||||||||||||||||||||||||||||
| All samples | [Expression pattern for all samples] | |||||||||||||||||||||||||||||||||
| AtGenExpress* (Development) |
266860_at
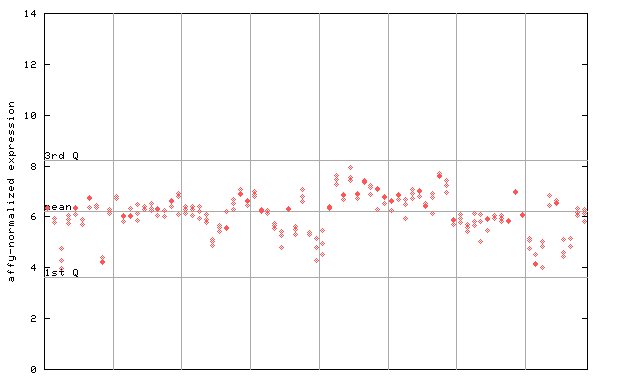
X axis is samples (pdf file), and Y axis is log2-expression. |
|||||||||||||||||||||||||||||||||
| AtGenExpress* (Stress) |
266860_at
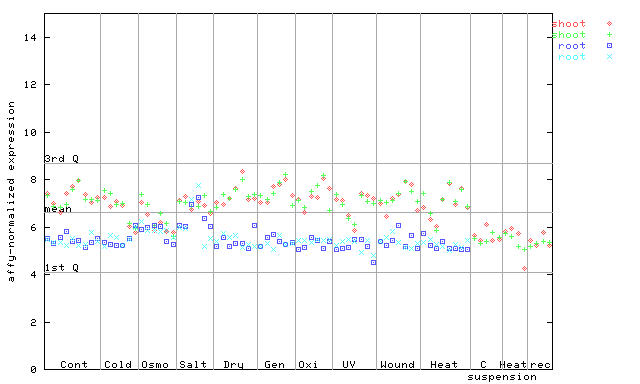
X axis is samples (pdf file), and Y axis is log2-expression. |
|||||||||||||||||||||||||||||||||
| AtGenExpress* (Hormone) |
266860_at
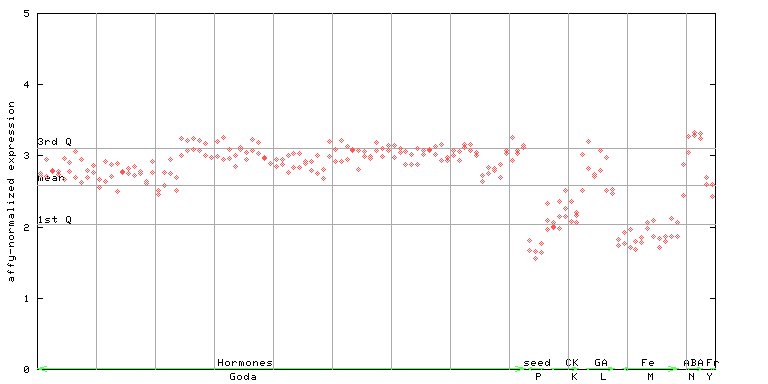
X axis is samples (xls file), and Y axis is log-expression. |
|||||||||||||||||||||||||||||||||


")
| Link to other DBs | ||
| Entrez Gene ID | 817228 |
|
| Refseq ID (protein) | NP_180255.1 | |
The preparation time of this page was 0.1 [sec].