[←][→] ath
| functional annotation | ||||||||
| Function | Exostosin family protein |


|
||||||
| GO BP |
|
|||||||
| GO CC |
|
|||||||
| GO MF |
|
|||||||
| KEGG | ||||||||
| Protein | NP_001324318.1 NP_001324319.1 NP_180759.2 | |||||||
| BLAST | NP_001324318.1 NP_001324319.1 NP_180759.2 | |||||||
| Orthologous | [Ortholog page] LOC103857410 (bra) LOC103865171 (bra) LOC103867681 (bra) | |||||||
| Subcellular localization wolf |
|
|||||||
| Subcellular localization TargetP |
|
|||||||
| Gene coexpression | ||||||||
| Network*for coexpressed genes |
||||||||
|---|---|---|---|---|---|---|---|---|
| Coexpressed gene list |
[Coexpressed gene list for AT2G31990] | |||||||
| Gene expression | ||||||||
| All samples | [Expression pattern for all samples] | |||||||
| AtGenExpress* (Development) |
265728_at
X axis is samples (pdf file), and Y axis is log2-expression. |
|||||||
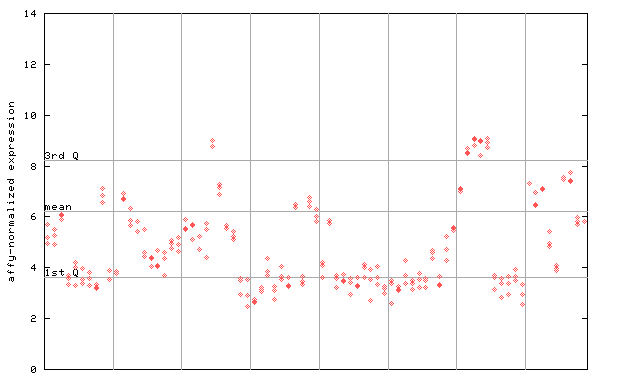
| AtGenExpress* (Stress) |
265728_at
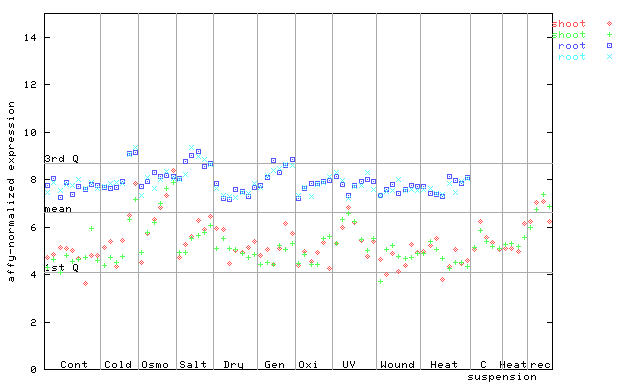
X axis is samples (pdf file), and Y axis is log2-expression. |
|||||||
| AtGenExpress* (Hormone) |
265728_at
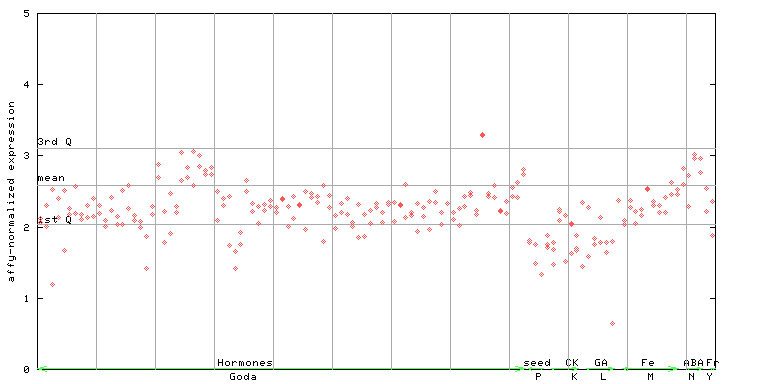
X axis is samples (xls file), and Y axis is log-expression. |
|||||||


| Link to other DBs | ||
| Entrez Gene ID | 817758 |
|
| Refseq ID (protein) | NP_001324318.1 | |
| NP_001324319.1 | |
|
| NP_180759.2 | |
|
The preparation time of this page was 0.2 [sec].