[←][→] ath
| functional annotation | ||||||||||||||||||||||||||||||||||||||||||
| Function | Lactoylglutathione lyase / glyoxalase I family protein |


|
||||||||||||||||||||||||||||||||||||||||
| GO BP |
|
|||||||||||||||||||||||||||||||||||||||||
| GO CC |
|
|||||||||||||||||||||||||||||||||||||||||
| GO MF |
|
|||||||||||||||||||||||||||||||||||||||||
| KEGG | ||||||||||||||||||||||||||||||||||||||||||
| Protein | NP_565737.1 NP_973579.1 | |||||||||||||||||||||||||||||||||||||||||
| BLAST | NP_565737.1 NP_973579.1 | |||||||||||||||||||||||||||||||||||||||||
| Orthologous | [Ortholog page] LOC4333625 (osa) LOC7474204 (ppo) LOC11444733 (mtr) LOC11444734 (mtr) LOC18101557 (ppo) LOC101245290 (sly) LOC103867665 (bra) LOC123047641 (tae) LOC123067935 (tae) LOC123087349 (tae) LOC123090584 (tae) LOC123095624 (tae) LOC123446940 (hvu) | |||||||||||||||||||||||||||||||||||||||||
| Subcellular localization wolf |
|
|||||||||||||||||||||||||||||||||||||||||
| Subcellular localization TargetP |
|
|||||||||||||||||||||||||||||||||||||||||
| Gene coexpression | ||||||||||||||||||||||||||||||||||||||||||
| Network*for coexpressed genes |
|
|||||||||||||||||||||||||||||||||||||||||
|---|---|---|---|---|---|---|---|---|---|---|---|---|---|---|---|---|---|---|---|---|---|---|---|---|---|---|---|---|---|---|---|---|---|---|---|---|---|---|---|---|---|---|
| Coexpressed gene list |
[Coexpressed gene list for AT2G32090] | |||||||||||||||||||||||||||||||||||||||||
| Gene expression | ||||||||||||||||||||||||||||||||||||||||||
| All samples | [Expression pattern for all samples] | |||||||||||||||||||||||||||||||||||||||||
| AtGenExpress* (Development) |
265673_at
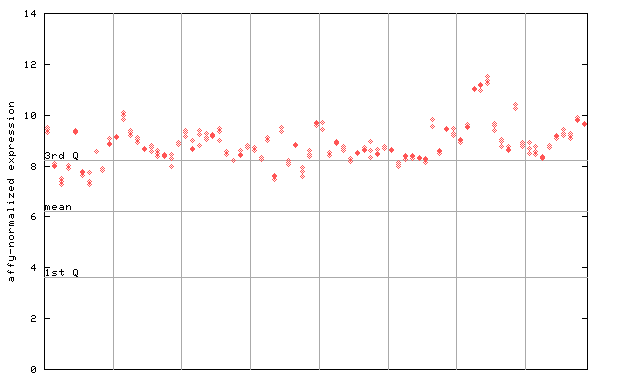
X axis is samples (pdf file), and Y axis is log2-expression. |
|||||||||||||||||||||||||||||||||||||||||
| AtGenExpress* (Stress) |
265673_at
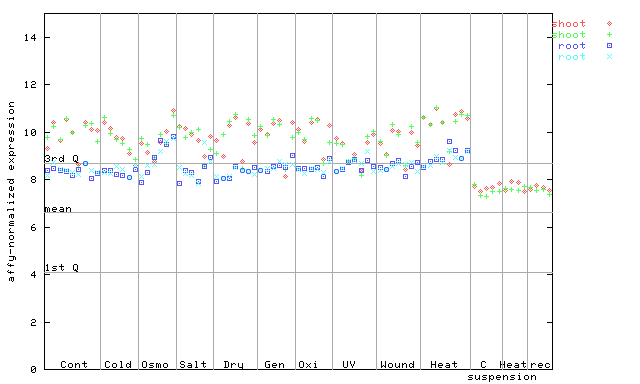
X axis is samples (pdf file), and Y axis is log2-expression. |
|||||||||||||||||||||||||||||||||||||||||
| AtGenExpress* (Hormone) |
265673_at
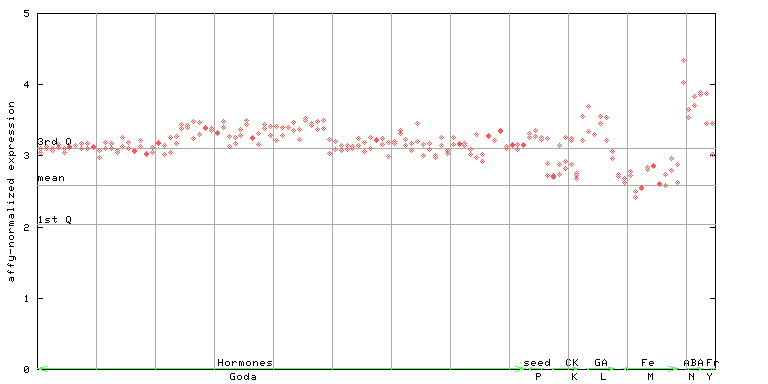
X axis is samples (xls file), and Y axis is log-expression. |
|||||||||||||||||||||||||||||||||||||||||


")
")
")
| Link to other DBs | ||
| Entrez Gene ID | 817769 |
|
| Refseq ID (protein) | NP_565737.1 | |
| NP_973579.1 | |
|
The preparation time of this page was 0.1 [sec].