[←][→] ath
| functional annotation | ||||||||||||||||||||||||||
| Function | phosphate 2 |


|
||||||||||||||||||||||||
| GO BP |
|
|||||||||||||||||||||||||
| GO CC |
|
|||||||||||||||||||||||||
| GO MF |
|
|||||||||||||||||||||||||
| KEGG | ath04120 [list] [network] Ubiquitin mediated proteolysis (155 genes) |  |
||||||||||||||||||||||||
| Protein | NP_850218.1 | |||||||||||||||||||||||||
| BLAST | NP_850218.1 | |||||||||||||||||||||||||
| Orthologous | [Ortholog page] LOC4339579 (osa) LOC7456794 (ppo) LOC11443820 (mtr) LOC18103023 (ppo) LOC25493164 (mtr) LOC100306246 (gma) LOC100784814 (gma) LOC100805463 (gma) LOC100809740 (gma) LOC101250073 (sly) LOC103865294 (bra) LOC123067599 (tae) LOC123145168 (tae) LOC123183027 (tae) LOC123449832 (hvu) | |||||||||||||||||||||||||
| Subcellular localization wolf |
|
|||||||||||||||||||||||||
| Subcellular localization TargetP |
|
|||||||||||||||||||||||||
| Gene coexpression | ||||||||||||||||||||||||||
| Network*for coexpressed genes |
|
|||||||||||||||||||||||||
|---|---|---|---|---|---|---|---|---|---|---|---|---|---|---|---|---|---|---|---|---|---|---|---|---|---|---|
| Coexpressed gene list |
[Coexpressed gene list for PHO2] | |||||||||||||||||||||||||
| Gene expression | ||||||||||||||||||||||||||
| All samples | [Expression pattern for all samples] | |||||||||||||||||||||||||
| AtGenExpress* (Development) |
267456_at
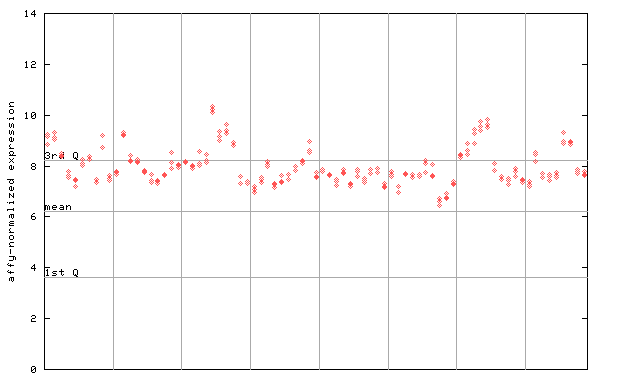
X axis is samples (pdf file), and Y axis is log2-expression. |
|||||||||||||||||||||||||
| AtGenExpress* (Stress) |
267456_at
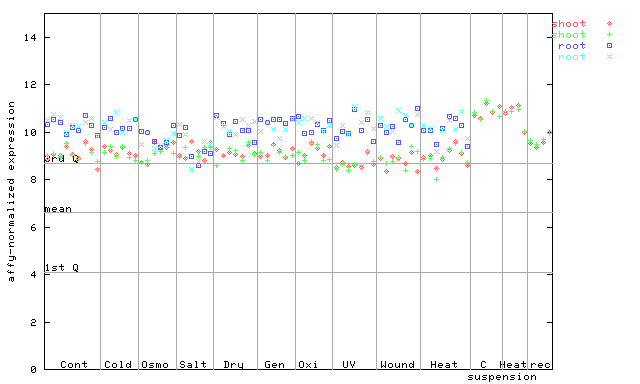
X axis is samples (pdf file), and Y axis is log2-expression. |
|||||||||||||||||||||||||
| AtGenExpress* (Hormone) |
267456_at
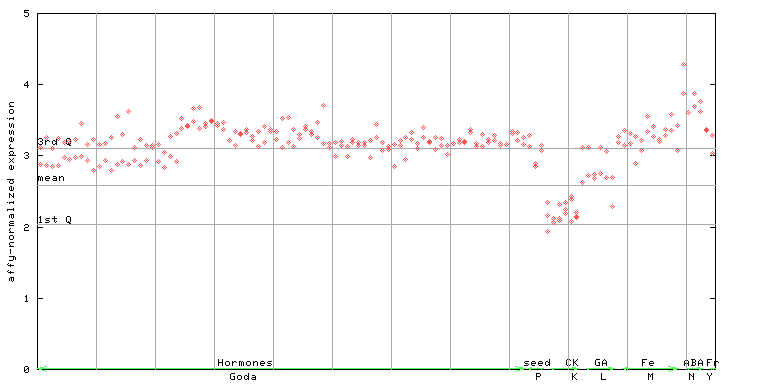
X axis is samples (xls file), and Y axis is log-expression. |
|||||||||||||||||||||||||


| Link to other DBs | ||
| Entrez Gene ID | 817943 |
|
| Refseq ID (protein) | NP_850218.1 | |
The preparation time of this page was 0.3 [sec].