[←][→] ath
| functional annotation | |||||||||||||||||||||||||||||||||||||||||||
| Function | Core-2/I-branching beta-1,6-N-acetylglucosaminyltransferase family protein |


|
|||||||||||||||||||||||||||||||||||||||||
| GO BP |
|
||||||||||||||||||||||||||||||||||||||||||
| GO CC |
|
||||||||||||||||||||||||||||||||||||||||||
| GO MF |
|
||||||||||||||||||||||||||||||||||||||||||
| KEGG | |||||||||||||||||||||||||||||||||||||||||||
| Protein | NP_565866.1 | ||||||||||||||||||||||||||||||||||||||||||
| BLAST | NP_565866.1 | ||||||||||||||||||||||||||||||||||||||||||
| Orthologous | [Ortholog page] LOC4332417 (osa) LOC7468681 (ppo) LOC11428108 (mtr) LOC100813028 (gma) LOC101255423 (sly) LOC101266407 (sly) LOC103867182 (bra) LOC123085459 (tae) LOC123092588 (tae) LOC123097888 (tae) LOC123449006 (hvu) | ||||||||||||||||||||||||||||||||||||||||||
| Subcellular localization wolf |
|
||||||||||||||||||||||||||||||||||||||||||
| Subcellular localization TargetP |
|
||||||||||||||||||||||||||||||||||||||||||
| Gene coexpression | |||||||||||||||||||||||||||||||||||||||||||
| Network*for coexpressed genes |
|
||||||||||||||||||||||||||||||||||||||||||
|---|---|---|---|---|---|---|---|---|---|---|---|---|---|---|---|---|---|---|---|---|---|---|---|---|---|---|---|---|---|---|---|---|---|---|---|---|---|---|---|---|---|---|---|
| Coexpressed gene list |
[Coexpressed gene list for AT2G37585] | ||||||||||||||||||||||||||||||||||||||||||
| Gene expression | |||||||||||||||||||||||||||||||||||||||||||
| All samples | [Expression pattern for all samples] | ||||||||||||||||||||||||||||||||||||||||||
| AtGenExpress* (Development) |
267170_at
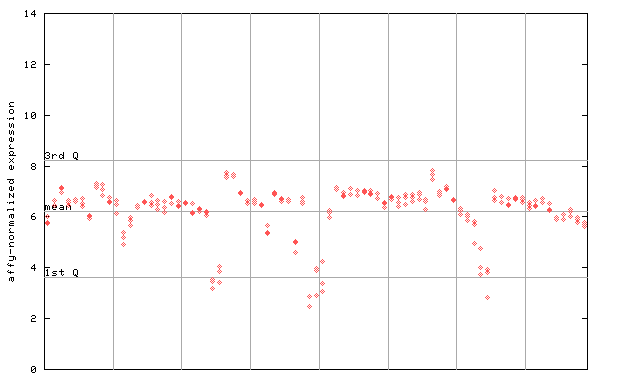
X axis is samples (pdf file), and Y axis is log2-expression. |
||||||||||||||||||||||||||||||||||||||||||
| AtGenExpress* (Stress) |
267170_at
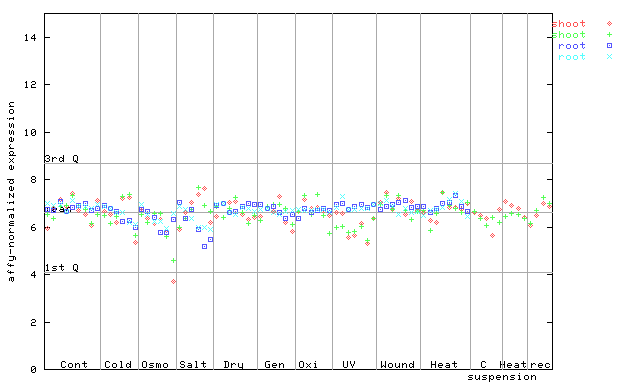
X axis is samples (pdf file), and Y axis is log2-expression. |
||||||||||||||||||||||||||||||||||||||||||
| AtGenExpress* (Hormone) |
267170_at
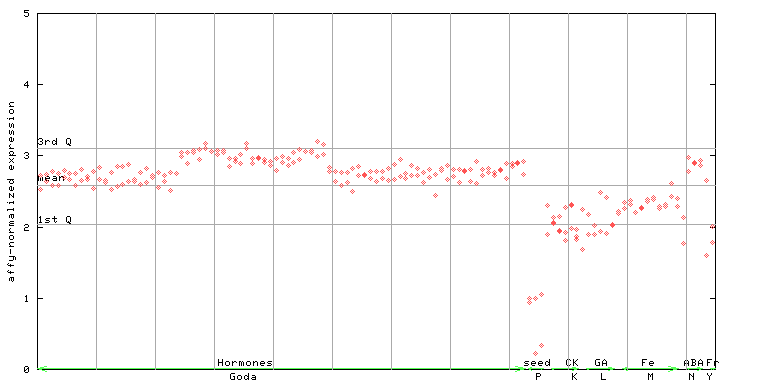
X axis is samples (xls file), and Y axis is log-expression. |
||||||||||||||||||||||||||||||||||||||||||


")
")
| Link to other DBs | ||
| Entrez Gene ID | 818335 |
|
| Refseq ID (protein) | NP_565866.1 | |
The preparation time of this page was 0.1 [sec].