[←][→] ath
| functional annotation | ||||||||||||||||||||||||||||||||||
| Function | Acyl-CoA N-acyltransferases (NAT) superfamily protein |


|
||||||||||||||||||||||||||||||||
| GO BP |
|
|||||||||||||||||||||||||||||||||
| GO CC |
|
|||||||||||||||||||||||||||||||||
| GO MF |
|
|||||||||||||||||||||||||||||||||
| KEGG | ||||||||||||||||||||||||||||||||||
| Protein | NP_001325143.1 NP_181433.1 NP_850308.1 NP_973638.1 | |||||||||||||||||||||||||||||||||
| BLAST | NP_001325143.1 NP_181433.1 NP_850308.1 NP_973638.1 | |||||||||||||||||||||||||||||||||
| Orthologous | [Ortholog page] LOC4331070 (osa) LOC7458662 (ppo) LOC7494953 (ppo) LOC11422977 (mtr) LOC100305894 (gma) LOC100803930 (gma) LOC100816118 (gma) LOC101255982 (sly) LOC103865699 (bra) LOC123128886 (tae) LOC123139416 (tae) LOC123146029 (tae) LOC123403901 (hvu) | |||||||||||||||||||||||||||||||||
| Subcellular localization wolf |
|
|||||||||||||||||||||||||||||||||
| Subcellular localization TargetP |
|
|||||||||||||||||||||||||||||||||
| Gene coexpression | ||||||||||||||||||||||||||||||||||
| Network*for coexpressed genes |
|
|||||||||||||||||||||||||||||||||
|---|---|---|---|---|---|---|---|---|---|---|---|---|---|---|---|---|---|---|---|---|---|---|---|---|---|---|---|---|---|---|---|---|---|---|
| Coexpressed gene list |
[Coexpressed gene list for AT2G39000] | |||||||||||||||||||||||||||||||||
| Gene expression | ||||||||||||||||||||||||||||||||||
| All samples | [Expression pattern for all samples] | |||||||||||||||||||||||||||||||||
| AtGenExpress* (Development) |
266188_at
X axis is samples (pdf file), and Y axis is log2-expression. |
|||||||||||||||||||||||||||||||||
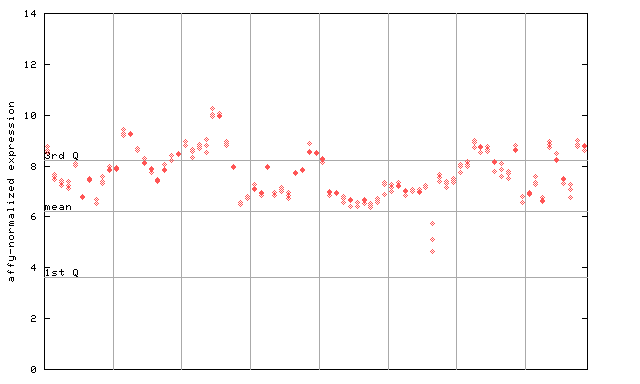
| AtGenExpress* (Stress) |
266188_at
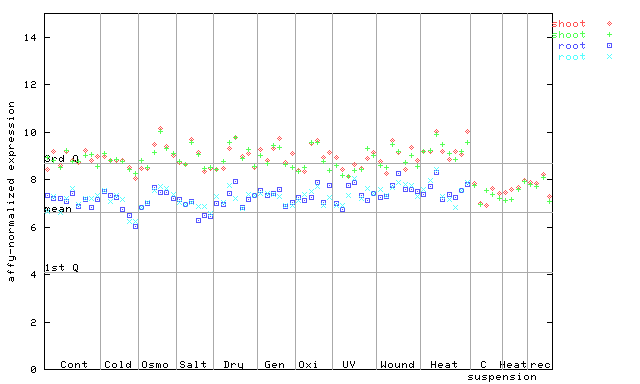
X axis is samples (pdf file), and Y axis is log2-expression. |
|||||||||||||||||||||||||||||||||
| AtGenExpress* (Hormone) |
266188_at
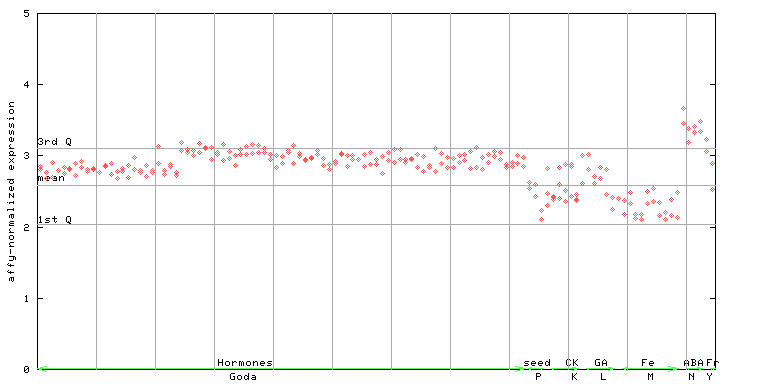
X axis is samples (xls file), and Y axis is log-expression. |
|||||||||||||||||||||||||||||||||


")
| Link to other DBs | ||
| Entrez Gene ID | 818486 |
|
| Refseq ID (protein) | NP_001325143.1 | |
| NP_181433.1 | |
|
| NP_850308.1 | |
|
| NP_973638.1 | |
|
The preparation time of this page was 0.1 [sec].